


For project managers in construction, creating a monthly progress report is an essential part of construction reporting. It helps in tracking progress, maintaining transparency with stakeholders, and ensuring that all aspects of the project are moving forward smoothly. While the task may seem time-consuming, an effective report is crucial for keeping projects aligned with deadlines, budgets, and quality standards.
This guide will walk you through the essential elements to include in your monthly progress report, offer a template, and explore how reporting software can simplify the process.
What is a Monthly Progress Report?
A monthly progress report is a document that tracks a project’s progress over a month. It summarizes completed tasks, ongoing work, challenges, and upcoming goals. These reports help project managers, teams, and stakeholders stay informed and make decisions based on real-time updates.
What to Include in Your Monthly Progress Report: Key Elements
Every monthly progress report needs to include core sections that provide valuable updates for your team and stakeholders. Here's a breakdown of the key elements on what to include in a monthly report:
1. Project Details
The Project Details section ensures that the report is clearly identifiable. It should include:
- Project name, code, and report series number
- Report date
- Project manager’s name
- Start and end dates
- Client or stakeholder details
This section provides basic information that helps stakeholders quickly reference the project progress report and ensures that everyone is on the same page.
2. Executive Summary
The Executive Summary offers a high-level overview of the project’s status. It should cover:
- The project’s primary objectives
- Key achievements during the reporting period
- Any significant challenges or roadblocks
- A quick status of the project’s budget, schedule, and scope using a Red, Amber, Green (RAG) indicator
A concise executive summary allows busy stakeholders to quickly understand the project's overall health.
3. Project Scope and Adjustments
The Project Scope section should include updates on:
- The current scope of the project
- Any adjustments made to the scope during the reporting period
- Progress toward milestones and completed tasks
- How scope changes have affected the schedule, budget, or resources
Keeping everyone informed about the project’s scope ensures clear expectations and prevents misunderstandings.
4. Progress Dashboard
A Progress Dashboard is a great way to visually present important data in your monthly progress report. This could include:
- Gantt charts to show the project’s timeline
- Milestone progress graphs
- KPI dashboards for cost, schedule, and scope
Dashboards make complex data easy to digest and provide a snapshot of the project’s overall status.

5. Review of KPIs
A project's Key Performance Indicators are the very measurement of its progress and success. The KPIs set at the beginning of the project anchor the project in terms of budget, schedule, resources, and overall plan.
Tracking KPIs in monthly reports for construction projects helps make quick decisions. Expect fluctuations, like in the stock market. Stay tuned for more detailed reporting on KPIs.

6. Health and Safety
In construction, safety is paramount. Include a Health and Safety section that covers:
- Any safety incidents or near misses during the reporting period
- Safety training or inspections conducted
- Compliance with relevant safety regulations
- Key safety statistics like Lost Time Injury Frequency Rate (LTIFR)
This section reassures stakeholders that the project is being managed safely.
7. Risk and Opportunity Management
The Risk and Opportunity Management section should outline:
- Key risks identified and their potential impact
- Mitigation strategies to address risks
- Opportunities that have emerged and how the project can benefit from them
This section keeps stakeholders informed about potential challenges and opportunities, allowing for proactive management.

8. Budget and Financial Performance
Provide an overview of the project’s budget and financial health in this section, including:
- A breakdown of actual costs vs. the project’s budget
- Forecasted costs to complete the project
- Key financial metrics like Forecasted Final Cost (FFC) and Estimate to Complete (ETC)
Including financial details ensures that stakeholders understand how the project is performing from a cost perspective.
9. Stakeholder Communications
Keep stakeholders informed by summarizing any meetings, feedback, and updates. The Stakeholder Communications section should include:
- Key stakeholder meetings held during the reporting period
- Feedback or concerns raised by stakeholders
- Approvals or decisions made by key project contributors
This section ensures that all stakeholders are up to date on the project’s progress and any changes that may affect them.

Other Information to Include in Your Construction Monthly Report
Sometimes, additional information is needed to provide a full picture of the project’s progress. Here are some additional information you want to add. Consider these as some good tips on how to write a project report that's concise and complete:
1. Table of Contents
For longer reports, adding a Table of Contents can be helpful for navigating the report. Stakeholders can easily jump to the sections most relevant to them, which is particularly useful for executives who may only need to see specific data.
2. Report Guidelines
Including Report Guidelines helps maintain consistency across your monthly reports. These guidelines can cover formatting rules, key metrics to track, and the overall tone or style of the report. This is particularly helpful when multiple people are involved in producing reports.
3. Appendices
If your report includes technical data or lengthy documents, such as risk registers or financial breakdowns, consider placing these in the Appendices. This keeps the main report clean and focused, while still providing stakeholders access to in-depth information when needed.
Important KPIs in Your Monthly Progress Report
When preparing a monthly progress report, it's critical to include Key Performance Indicators (KPIs) that track the project’s success. Here are four important KPIs to include:
1. Schedule Progress vs. Plan
This KPI tracks whether the project is on schedule. Comparing actual progress against planned milestones helps identify whether the project is behind or ahead of schedule.
2. Cost vs. Budget
This KPI tracks how the project is performing financially by comparing actual expenditures against the approved budget. It provides insights into potential cost overruns or savings.
3. Scope vs. Plan
This KPI tracks changes to the project’s scope. It is important to monitor any deviations from the original scope, as scope creep can impact time, cost, and resource management.
4. Planned vs. Actual Resourcing
This KPI compares planned resources, such as labor and materials, to what has been used so far. It helps ensure that resources are being allocated efficiently and that the project remains on track.
Including these KPIs in your monthly progress report provides stakeholders with measurable insights into the project’s progress and health.
Monthly Progress Report Template
Creating a structured and consistent template for your project monthly report ensures that all relevant information is captured and easily accessible.
A well-organized monthly progress report template should include the key elements discussed above - such as project details, an executive summary, risk management, KPIs, and financial updates. By following a consistent format, you make it easier for stakeholders to compare reports and track progress over time.

Monthly Progress Reporting Software
Creating a monthly report can be time-consuming, but it doesn’t have to be. With modern project management and construction reporting software, much of the reporting process can be automated. These tools can:
- Collect data from multiple areas of the project
- Automatically generate dashboards and visualizations
- Provide real-time updates on costs, schedules, and risks
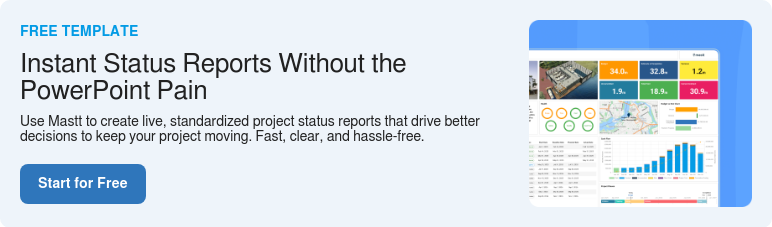
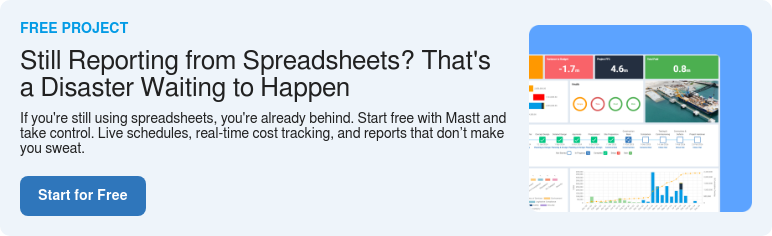
Platforms like Mastt simplify the entire process, providing a central hub for project management and reporting. This software pulls together key data, saving time and reducing the potential for manual errors.
Conclusion: Mastering Your Monthly Progress Reporting
A well-organized monthly progress report is essential for maintaining clarity, managing risks, and keeping stakeholders informed. By including key elements like project details, financial updates, KPIs, and a risk assessment, you ensure that your team and stakeholders have the information they need to make timely decisions.

Written by
Cherie Gozon
Cherie Gozon is a content writer with over 10 years of experience specializing in project management content. As a Content Team Lead, Cherie focuses on creating and implementing website SEO strategies. She was part of the team that launched and executed the SEO efforts at Mastt, significantly boosting the company’s online presence.


Contributions by

Monthly Report Template Word
Download this FREE Monthly Report Template in Word to track progress, summarize results, and keep stakeholders informed with clear, structured project reporting.

Walk Into Every Meeting With Confidence, Clarity, and Control
No one wants to look unprepared, blindsided, or uncertain in front of stakeholders — but that’s exactly what happens without Mastt.
Start for FreeTrusted by the bold, the brave, and the brilliant across governments, Fortune 500s, and the world’s best in delivering the future


.avif)

