
![S Curve in Capital Projects: Meaning, Formula, Examples [FREE Calculator]](https://cdn.prod.website-files.com/607f739c92f9cf647516b37b/674e50fe1d6f90c15b66591f_S-Curve-in-Capital-Projects.avif)
An S curve is that famous S-shaped graph that tracks how projects progress. It starts slow, picks up speed, and winds down smoothly.
Why does it matter? Because it helps you see the big picture without drowning in data. From spotting delays to managing costs, an S curve gives you all the insights to keep your construction projects on track and stress-free.
What is an S Curve?
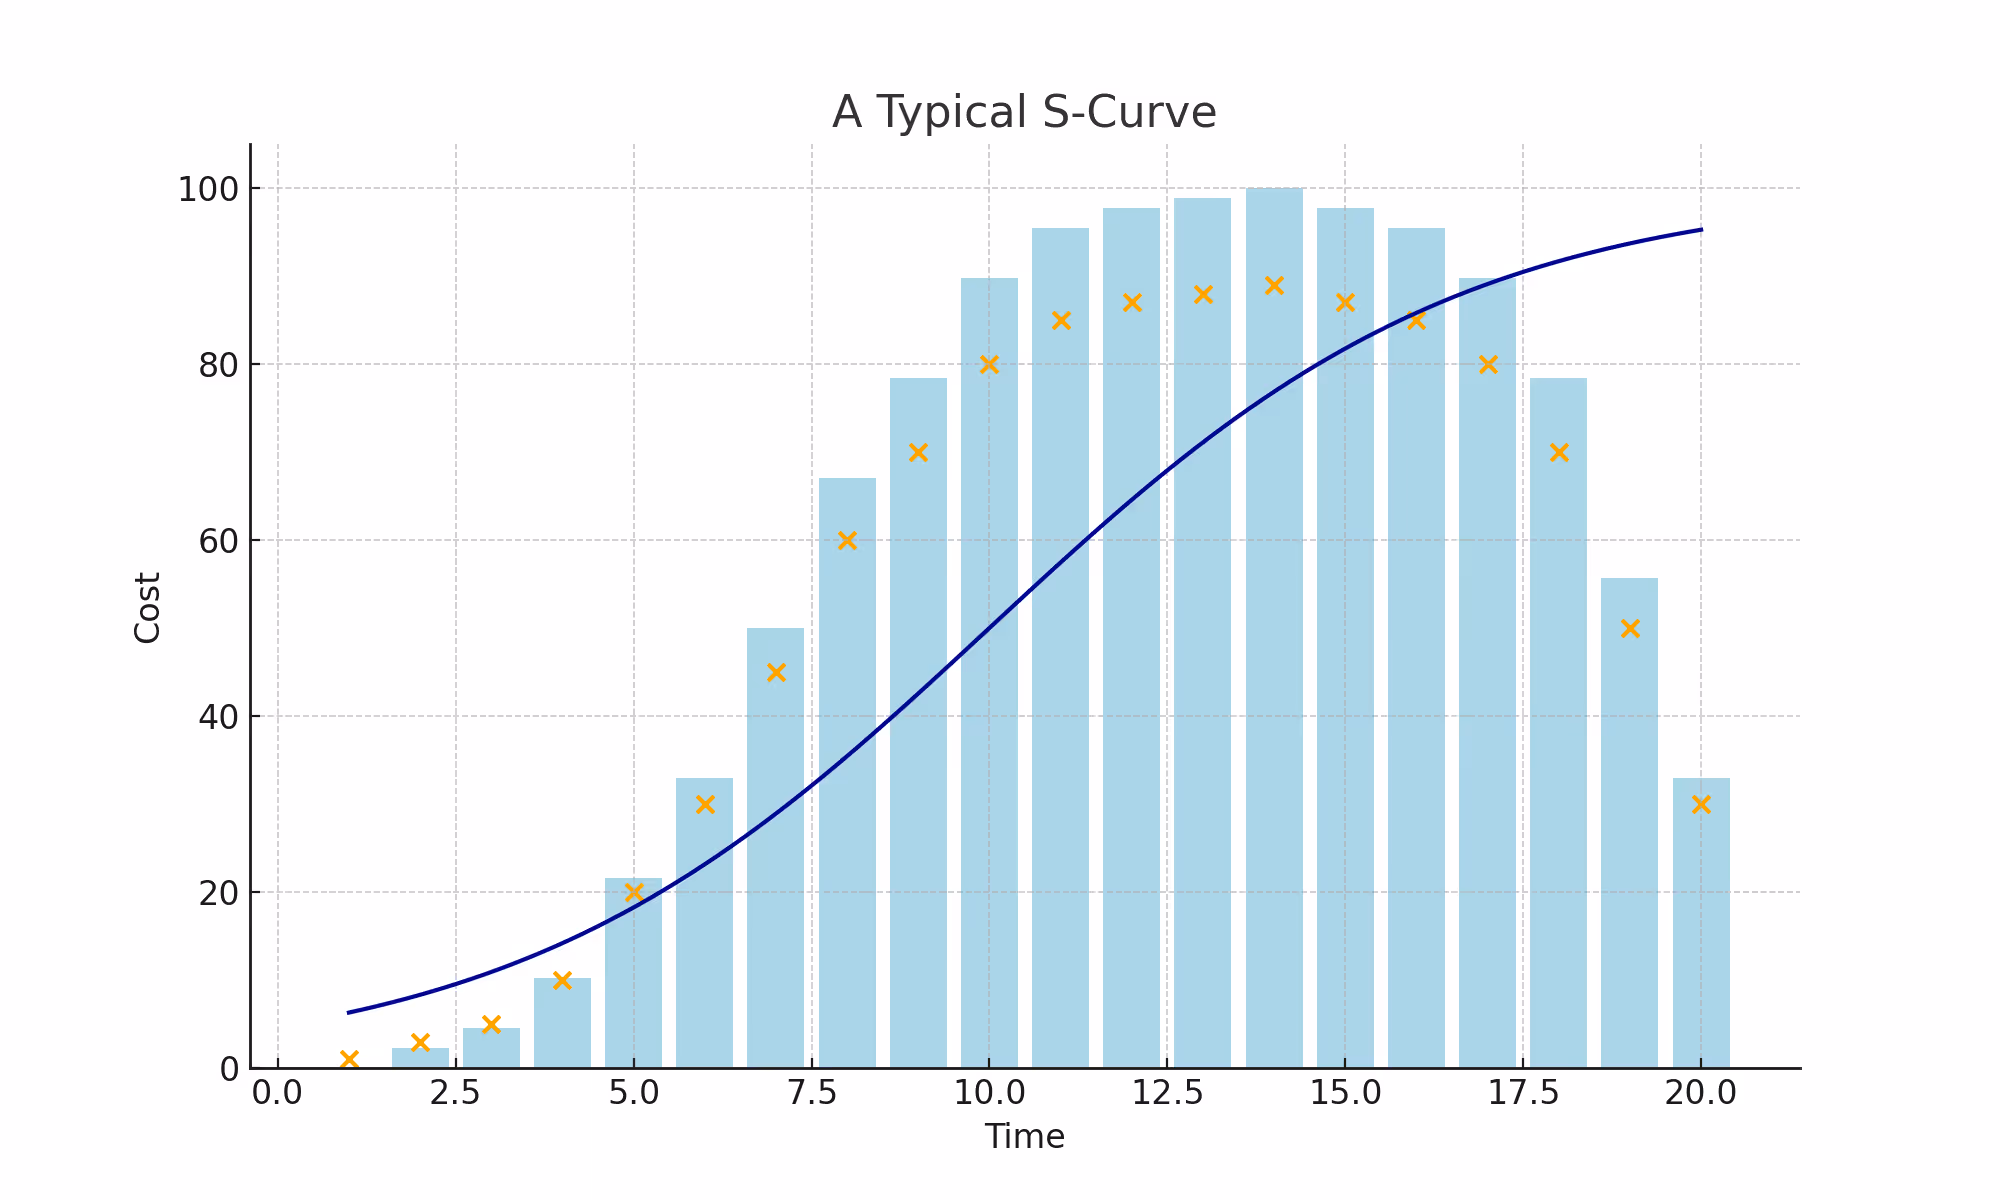
An S curve is a graph that visualizes project progress, costs, or resource usage over time. Named for its S-shaped curve, it represents how most projects flow: starting slow, accelerating during peak activity, and tapering off as they near completion.
In construction forecasting, S curves help compare planned and actual progress, track resource allocation, and monitor budgets. This simple tool provides clear insights into construction budgeting and performance, ensuring timelines and costs stay on track.
How S Curves Work in Project Management
In project cost management, S curves help compare what’s planned versus what’s actually happening. They highlight areas where resources are stretched thin or underused, giving managers the insights they need to make adjustments. With an S curve, you can spot risks early, stay on budget, and keep your project running smoothly.
Here’s how the S curve aligns with each phase of a project’s lifecycle:
1. Initiation phase: slow beginnings
At the start, the S curve is flat. Why? This phase involves setup tasks and resource mobilisation, which take time but don’t show much progress. Minimal spending and activity are the norm here.
2. Construction start-up: momentum builds
As the project picks up pace, the S curve takes a sharp upward turn. This phase is all about heavy lifting. Allocating labor, materials, and funds to get things moving. It’s the busiest time, with progress skyrocketing.
3. Construction maturity: steady rhythm
Once the project hits its stride, progress stabilizes. The S curve begins to level out, reflecting consistent activity and balanced resource use. This phase is where everything runs like a well-oiled machine.
4. Completion phase: wrapping up
Near the end, the S curve flattens again. Most tasks are done, expenses drop, and active work tapers off. It’s the final stretch where the focus shifts to closing out the project.
For client-side project managers, this phase is where the S curve really shines. It shows exactly where workload peaks happened, highlights lingering risks, and reveals if the project is falling behind. With these insights, you can confirm everything’s on track and deliver a successful project.
Here's a real example of an S Curve on a capital works program. You can see historical actuals in green and then forward cash flow in blues (committed), dark blue (uncommitted), and yellow (risk).
.avif)
How to S Curve: S Curve Function and S Curve Formula
The S curve function and formula are the foundation for tracking project progress accurately. They convert raw data into a visual tool that highlights milestones, trends, and potential risks, making them essential for project managers.
What is the S Curve formula?
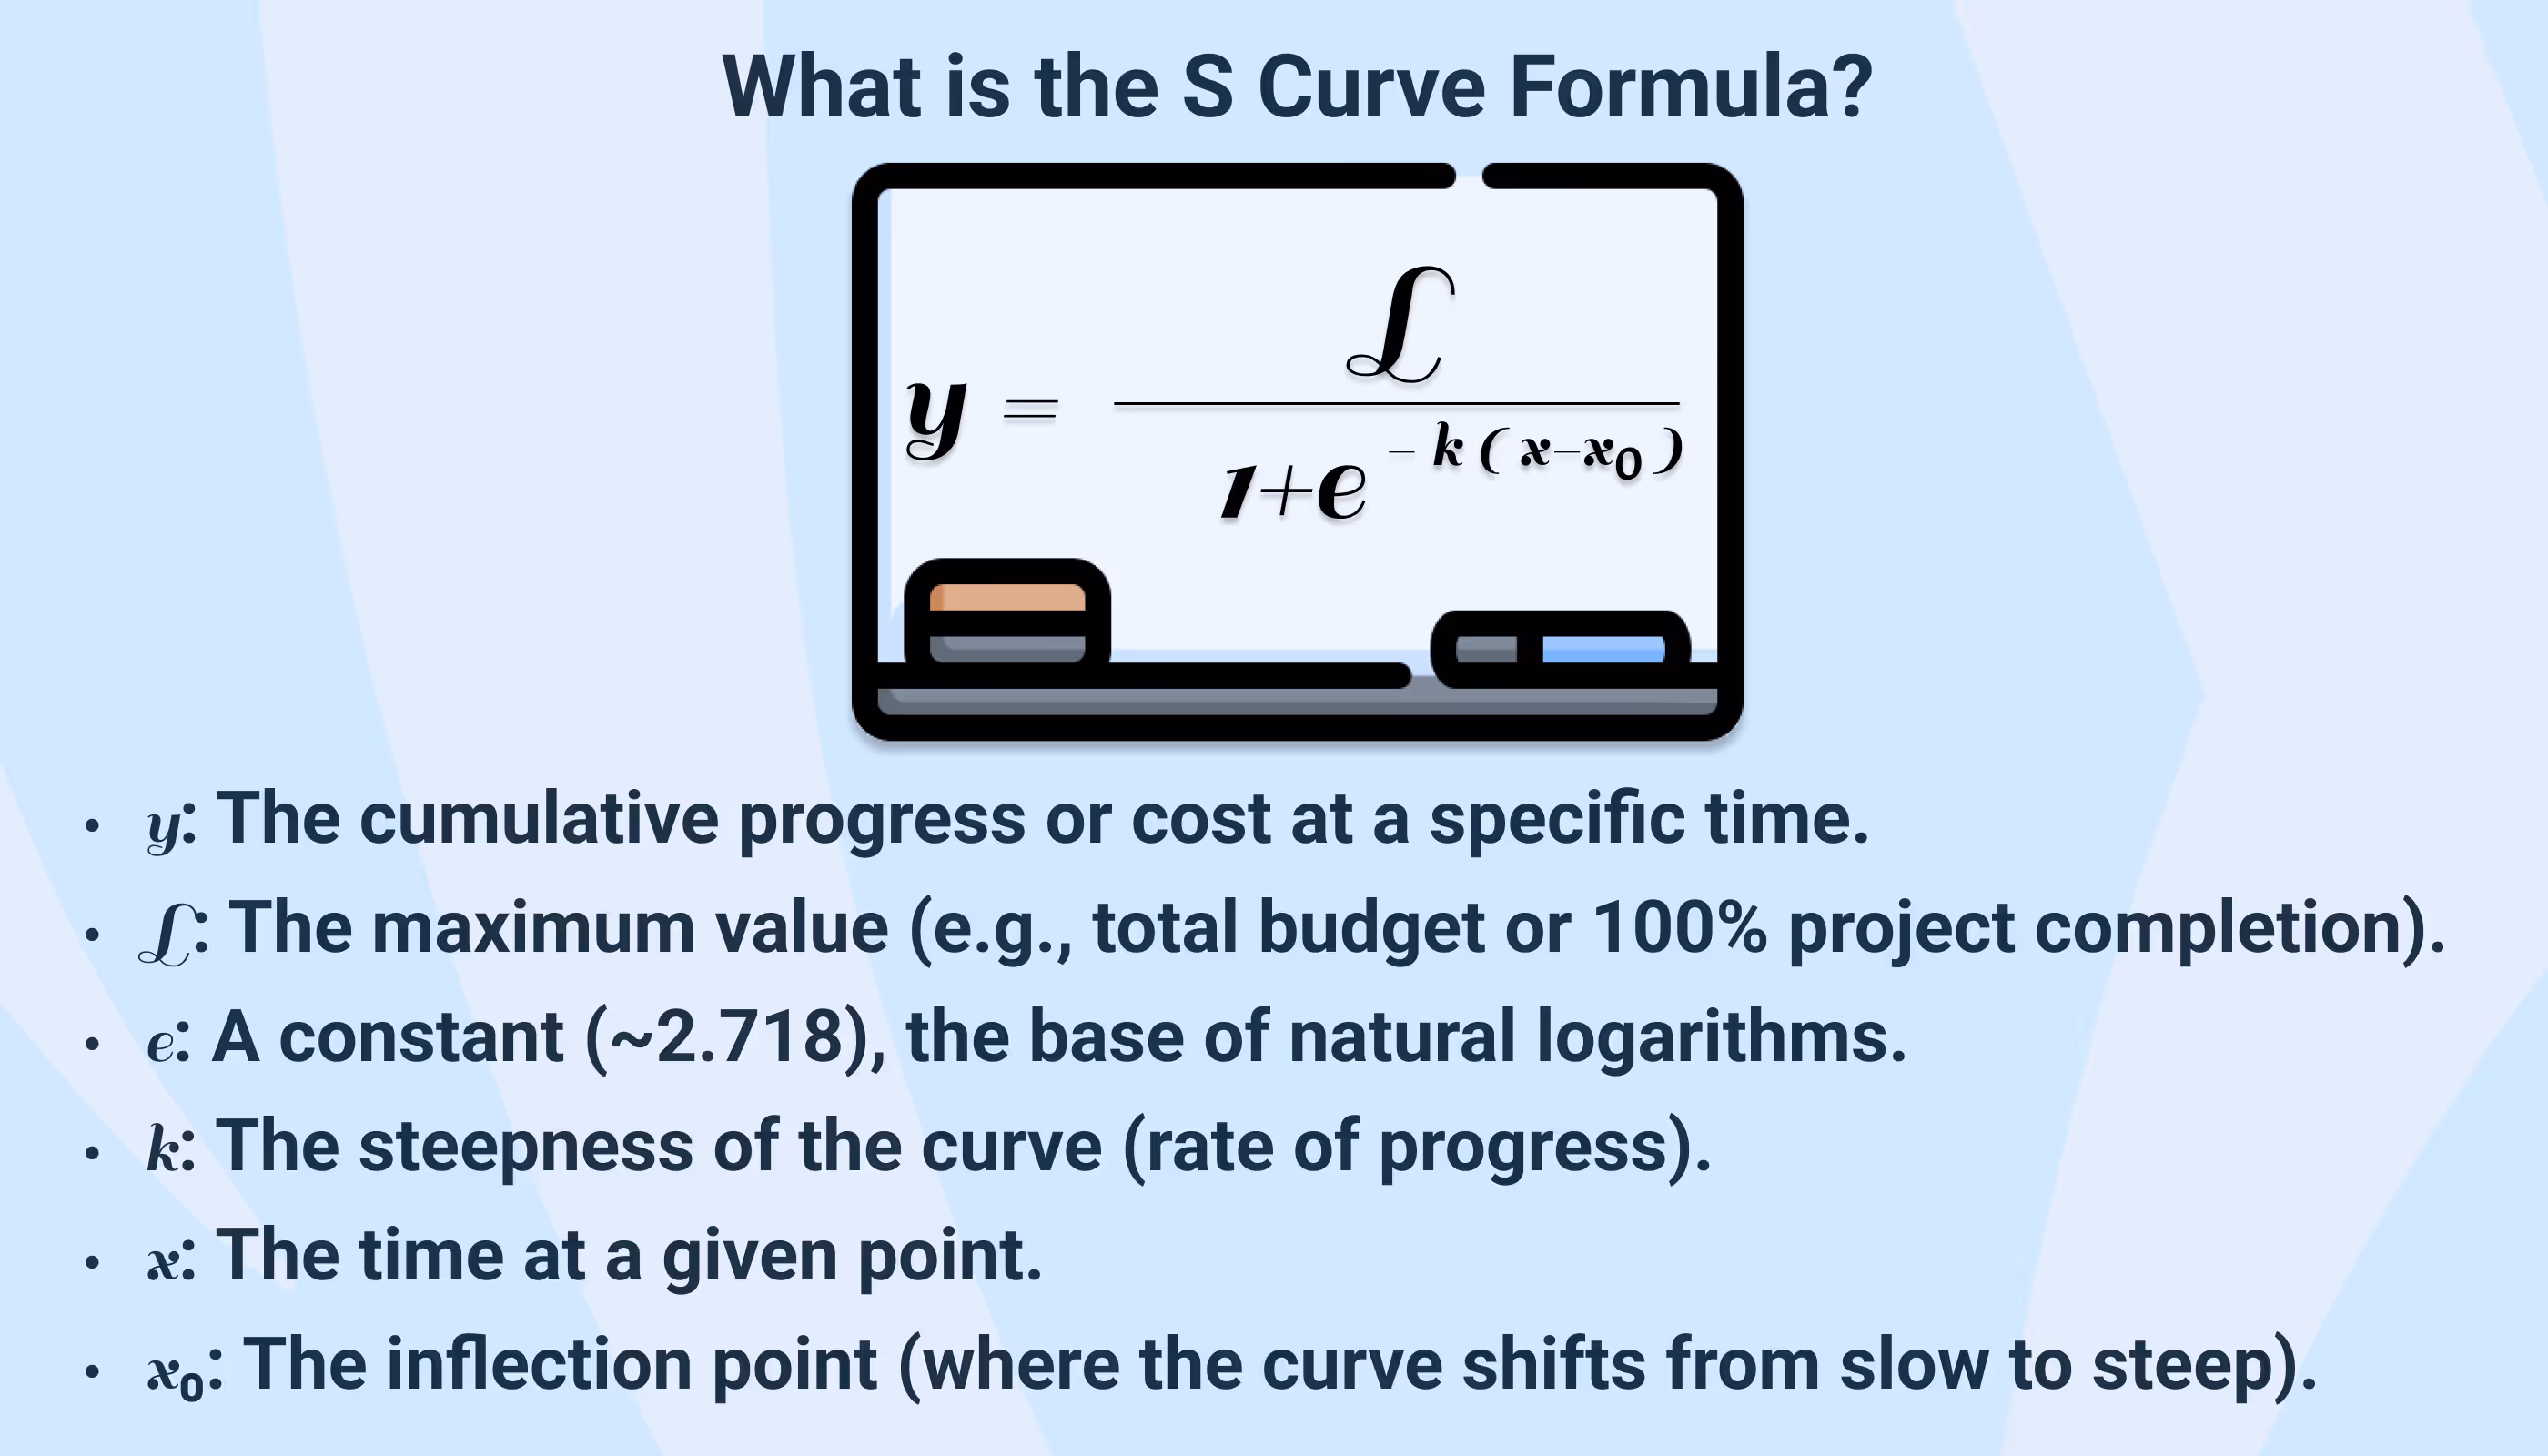
The S curve formula is based on a logistic function, which calculates cumulative progress over time. Here’s the general equation:
y = L / (1 + e^(-k(x - x₀)))
Where:
- y: The cumulative progress or cost at a specific time.
- L: The maximum value (e.g., total budget or 100% project completion).
- e: A constant (~2.718), the base of natural logarithms.
- k: The steepness of the curve (rate of progress).
- x: The time at a given point.
- x₀: The inflection point (where the curve shifts from slow to steep).
How to use the S Curve formula
Applying this formula is easier than it looks! Here’s how it works in real-world projects:
- Create Your Baseline: Use your project plan to set key milestones, budgets, and timelines.
- Input Data: Plot planned progress using the formula to generate a baseline S curve.
- Track Actual Progress: Update the curve with real-time data to see how the project is performing.
- Spot Variances: Compare actual vs. planned progress to identify delays or budget overruns.
Why it matters: The formula helps you predict trends, manage resources, and adjust plans proactively.
Budget vs Actual: S Curve Benchmarking
It is also good practice to show an S curve plotted against the planned progress (baseline) against the actual progress. Constructing an S curve baseline should start with a detailed project plan, from which a baseline projection is created from the first principles or the formula above.
As the project progresses, actual data is integrated, with the S curve serving to analyze performance and guide adjustments.

.avif)
Advanced Techniques and Considerations for S Curve Analysis
S curve analysis, when combined with advanced techniques, becomes a powerful tool for managing complex projects. These methods allow you to go beyond basic progress tracking, providing deeper insights into performance, risks, and resource optimization.
1. Earned Value Management (EVM) integration
Pairing S curve analysis with Earned Value Management (EVM) creates a complete view of project performance. EVM adds layers of cost and schedule tracking, ensuring your project stays aligned with its objectives.
How it works:
- Planned Value (PV): Tracks the work scheduled to be completed by a specific point in time.
- Earned Value (EV): Shows the value of work actually completed.
- Actual Cost (AC): Reflects what’s been spent to achieve the EV.
Overlaying these metrics on your S curve helps detect variances between planned and actual progress.
Example: If your EV is below your PV but your AC is rising, your S curve will reveal a cost overrun risk that needs immediate attention.
2. Scenario analysis for risk management
Scenario analysis lets you test how changes in timelines, resources, or budgets impact your project. By simulating different scenarios, you can anticipate challenges and make informed adjustments.
Steps for scenario analysis:
- Identify variables such as resource allocation, weather delays, or budget cuts.
- Adjust inputs to simulate possible outcomes.
- Compare results to identify risks and potential solutions.
Use case: By adjusting the timeline on your S curve, you can see how delays in one phase might cascade into other phases and prepare accordingly.
3. Continuous data integration
The power of S curve analysis lies in its accuracy. Continuous updates ensure your curve reflects the current state of your project, enabling timely decisions.
Benefits of real-time updates:
- Detect delays and inefficiencies as they occur.
- Keep resource allocation aligned with actual project needs.
- Provide accurate, up-to-date reports to stakeholders.
4. Forecasting with S Curves
S curves are not only about tracking, they’re also invaluable for cost forecasting in construction. By extrapolating from current trends, you can predict whether your project will meet key milestones, stay on budget, or face bottlenecks.
Construction forecasting best practices:
- Extend the S curve based on the current rate of progress.
- Use historical data to refine predictions for future phases.
- Communicate forecasts clearly to stakeholders to align expectations.
5. Variance analysis for project control
Variance analysis compares your baseline S curve with the actual curve to identify gaps in progress, costs, or timelines.
Key metrics to analyze:
- Schedule Variance (SV): Are you ahead or behind on tasks?
- Cost Variance (CV): Is spending aligned with the budget?
- Performance Indexes: Measure overall efficiency using metrics like CPI (Cost Performance Index) and SPI (Schedule Performance Index).
Actionable insight: Variance analysis allows you to pinpoint issues and correct course before they escalate.
Best S Curve Reporting: Why Accuracy and Timeliness Matter
When it comes to S curve reporting, accuracy and timeliness are everything. For large, complex projects, an outdated or incomplete S curve can lead to misinformed decisions, missed deadlines, and blown budgets. That's where the right construction project cost management software make all the difference.
How Mastt Simplifies S Curve Reporting
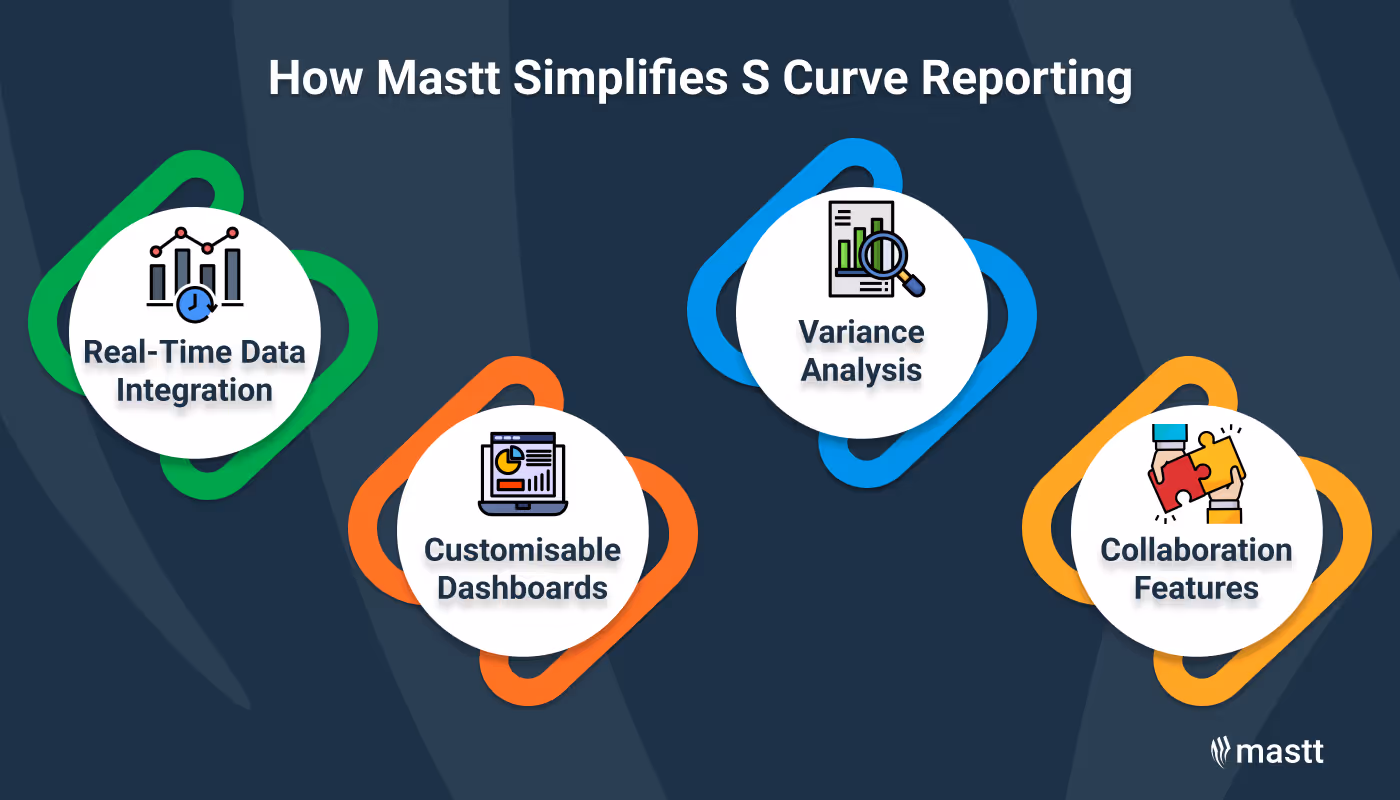
Mastt is designed to eliminate the headaches of manual reporting. With Mastt, you get:
- Real-Time Data Integration: Automatically sync data from multiple sources, ensuring your S curve reflects the latest project progress.
- Customizable Project Dashboards: Create tailored reports that show exactly what you and your stakeholders need to see.
- Variance Analysis: Identify gaps between planned and actual progress instantly, so you can act fast.
- Collaboration Features: Keep all teams aligned with shared data and centralized reporting tools.
Why Choose Mastt for S Curve Reporting?
Mastt elevates your project standards by delivering cost report software that standardizes financial transparency and variance analysis across your capital works program. By automating the process and offering deep insights, Mastt helps you:
- Reduce Errors: Say goodbye to manual data entry mistakes.
- Save Time: Focus on decision-making instead of crunching numbers.
- Stay Ahead of Risks: Get instant alerts when variances appear, so you can correct course quickly.
💡 Pro Tip: Mastt’s scenario analysis features let you simulate changes in timelines or budgets, giving you a proactive edge in risk management.
For large-scale projects, the best S curve reporting combines accuracy, timeliness, and smart tools. Mastt is built to do exactly that, providing real-time insights, seamless collaboration, and actionable reports. With Mastt, you’re not just tracking progress, you’re taking control of it.

Conclusion
S curve analysis is essential for effective project management. It helps track progress, spot risks early, and make informed decisions to keep your projects on time and within budget.
By using techniques like variance analysis and real-time updates, you can optimize performance and achieve better outcomes. S curves empower you to take control of your projects and deliver success with confidence.

Written by
Jacob Gibbs
Jacob Gibbs is the Customer Success Team Lead at Mastt. He guides capital project teams through onboarding and helps them get the most out of Mastt’s project management tools. With five years in customer success and a good track record supporting construction clients, Jacob brings a practical, hands-on approach to solving real project challenges.


Contributions by
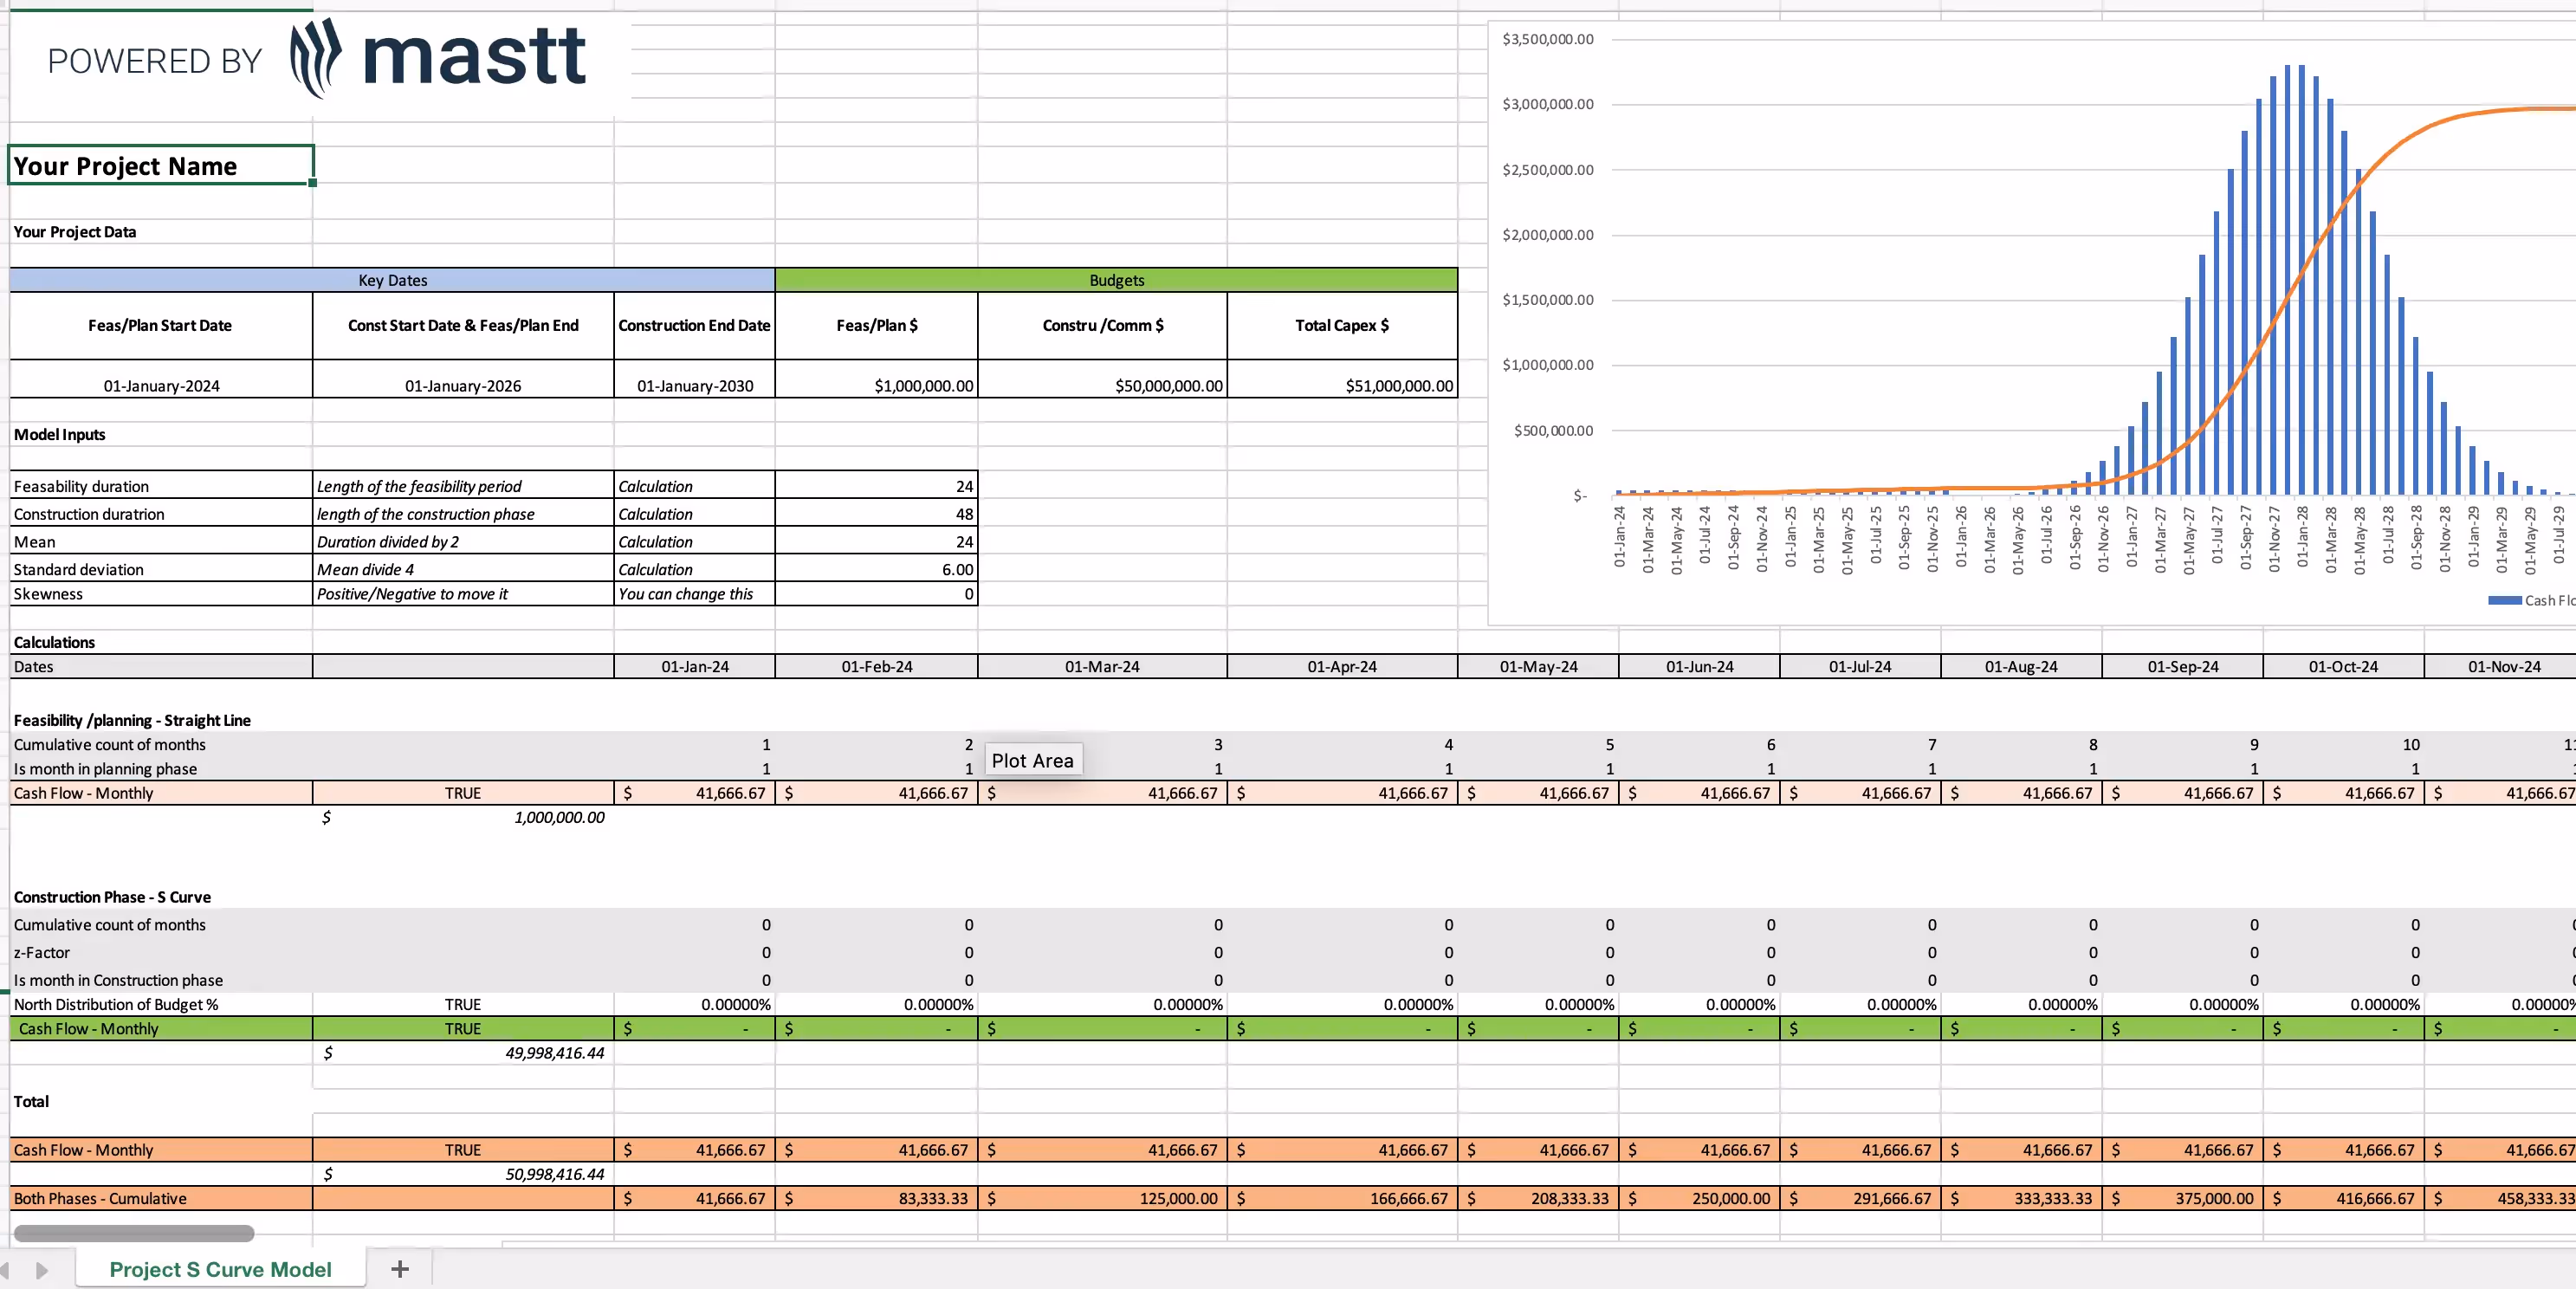
S Curve in Excel
Download the FREE S Curve Excel template to track progress, manage costs, and monitor performance in construction projects.

Walk Into Every Meeting With Confidence, Clarity, and Control
No one wants to look unprepared, blindsided, or uncertain in front of stakeholders — but that’s exactly what happens without Mastt.
Start for FreeTrusted by the bold, the brave, and the brilliant across governments, Fortune 500s, and the world’s best in delivering the future