
.avif)
We're excited to announce a mini revolution in reporting thanks to our latest product release
Project Management Consultancies and Asset Owners in the construction industry have always sought to improve their reporting. They’d like to make it easier, more data-driven and real-time to support decision-makers who rely on accurate and up-to-date information when delivering the future built environment.
This industry-staple information has typically been delivered via two primary reporting artefacts. One is the Dashboards, prepared weekly, fortnightly or monthly. The other is Monthly Reports or Project reports, prepared monthly.
With increasing amounts of data being generated and the desire of clients and sponsors for more transparency, it's challenging to prepare these reports in a way that meaningful visualizes & analyzes data. It is also extremely time-consuming to prepare multiple, complex reports and dashboards with data from different sources on a regular cadence.

Our mission to develop an amazing solution
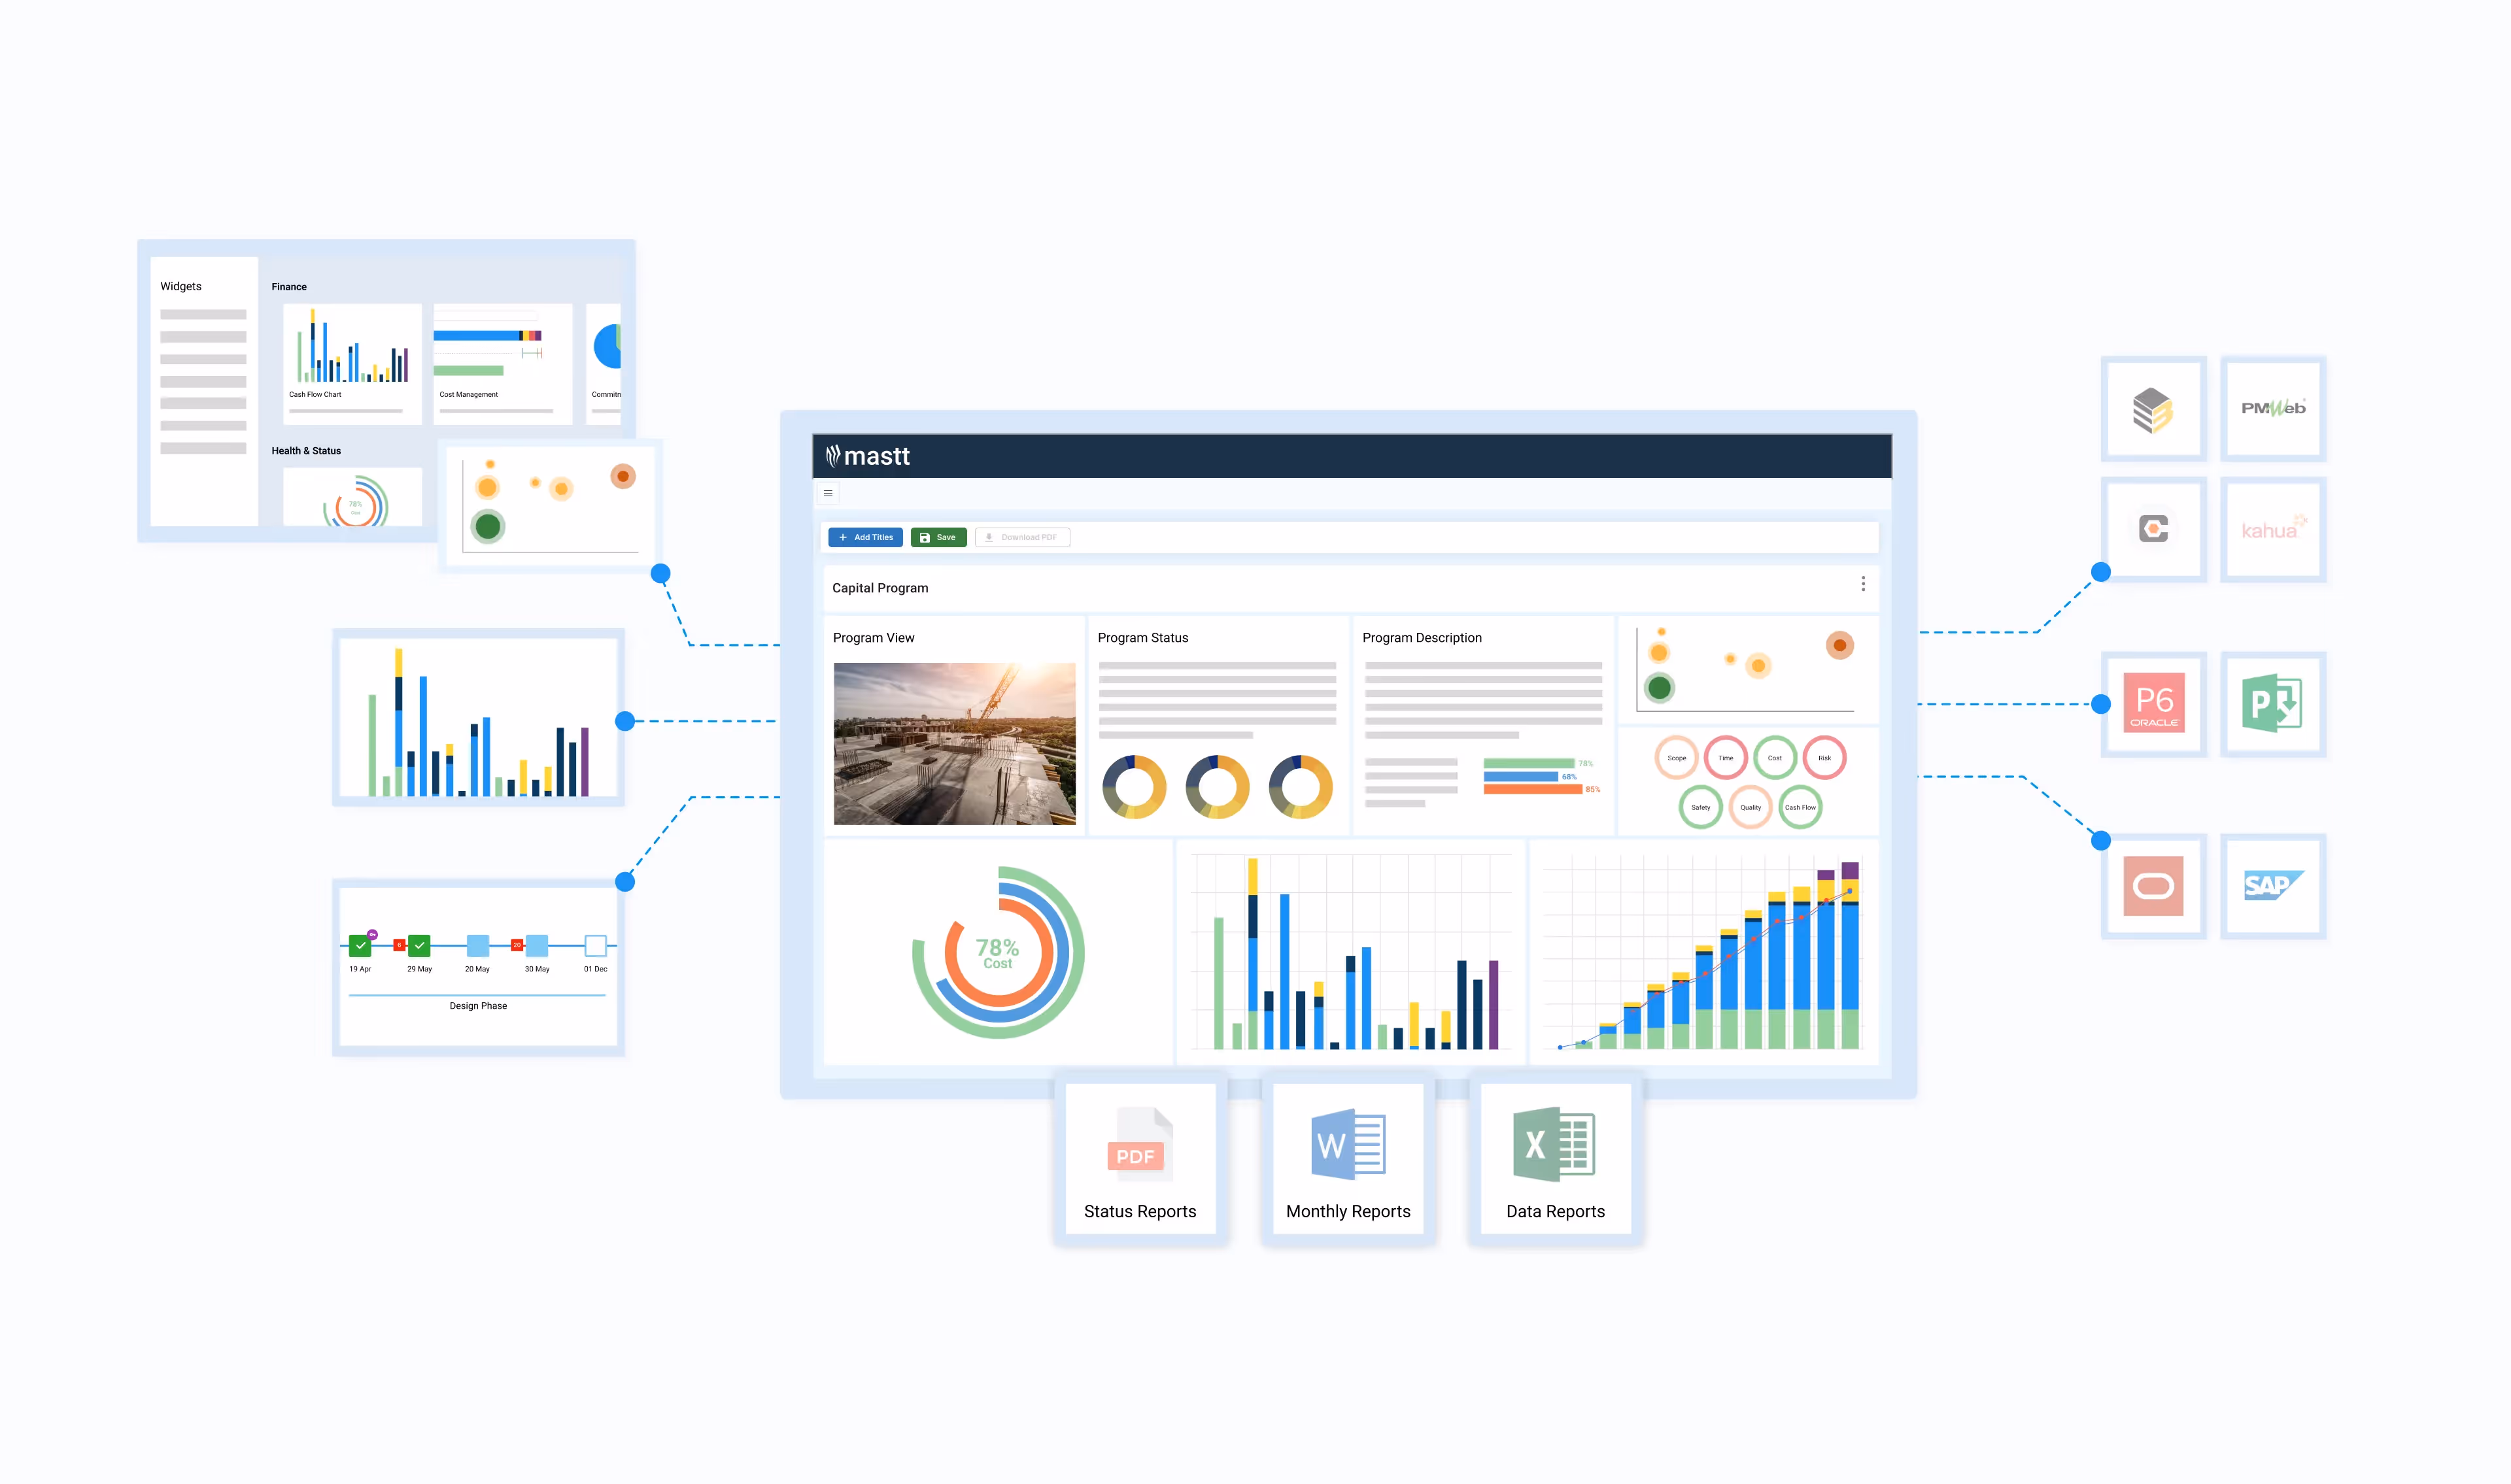
Solving this problem is perfectly aligned with our mission, which is to enable built environments to be delivered efficiently and sustainably through easy to use digital tools. That's why we're excited to introduce a new custom dashboard and reporting solution so you can create any report easily and FAST!
We think it's a ground-breaking new product specifically for Asset Owners and Program Management consultants in the construction industry.
Create amazing visual reports for sharing, printing or presenting
Our new reporting tool makes it easy for PM Consultants and Asset Owners to create custom reports that visualize and analyze data to then share, print or present. This allows executives to make better and faster decisions and increase their efficiency in delivering the future built environment.

Here are a few of our favourite benefits:
Flexibility
The platform now allows you to report and display data in any way that you (or your client) finds easy to understand super fast.
Time-saving
From our component library, you can add pre-configured tiles for charts, graphs, and tables fed with real time data from Mastt modules. You’ll save a ton of time compared to preparing these manually and totally kill duplication of effort. You can also Customize and Configure tiles how you like them so your reports have the right look and feel.

Share, Print or Present
Collaboration is now easier than ever as you can share your dashboards and reports with your client-side project manager or teams, ensuring that everyone has access to the same information. You can also set permissions, giving you complete control over who has access to sensitive data.
.gif)
Standardized Templates
You can now create multiple dashboards and reports from templates, all powered by a single data source. You can also create dashboards for weekly, monthly status, or a longer form monthly report all updating in sync with no duplication of effort. Use reporting templates across an organization to maintain consistency of service and presentation.
A Reporting Platform
As part of our vision, Mastt is working towards becoming the central system that connects your data from a range of sources, making it easy to bring all your reporting data together in one place. This saves you time and reduces the risk of errors, freeing up valuable resources that can be redirected to other tasks.
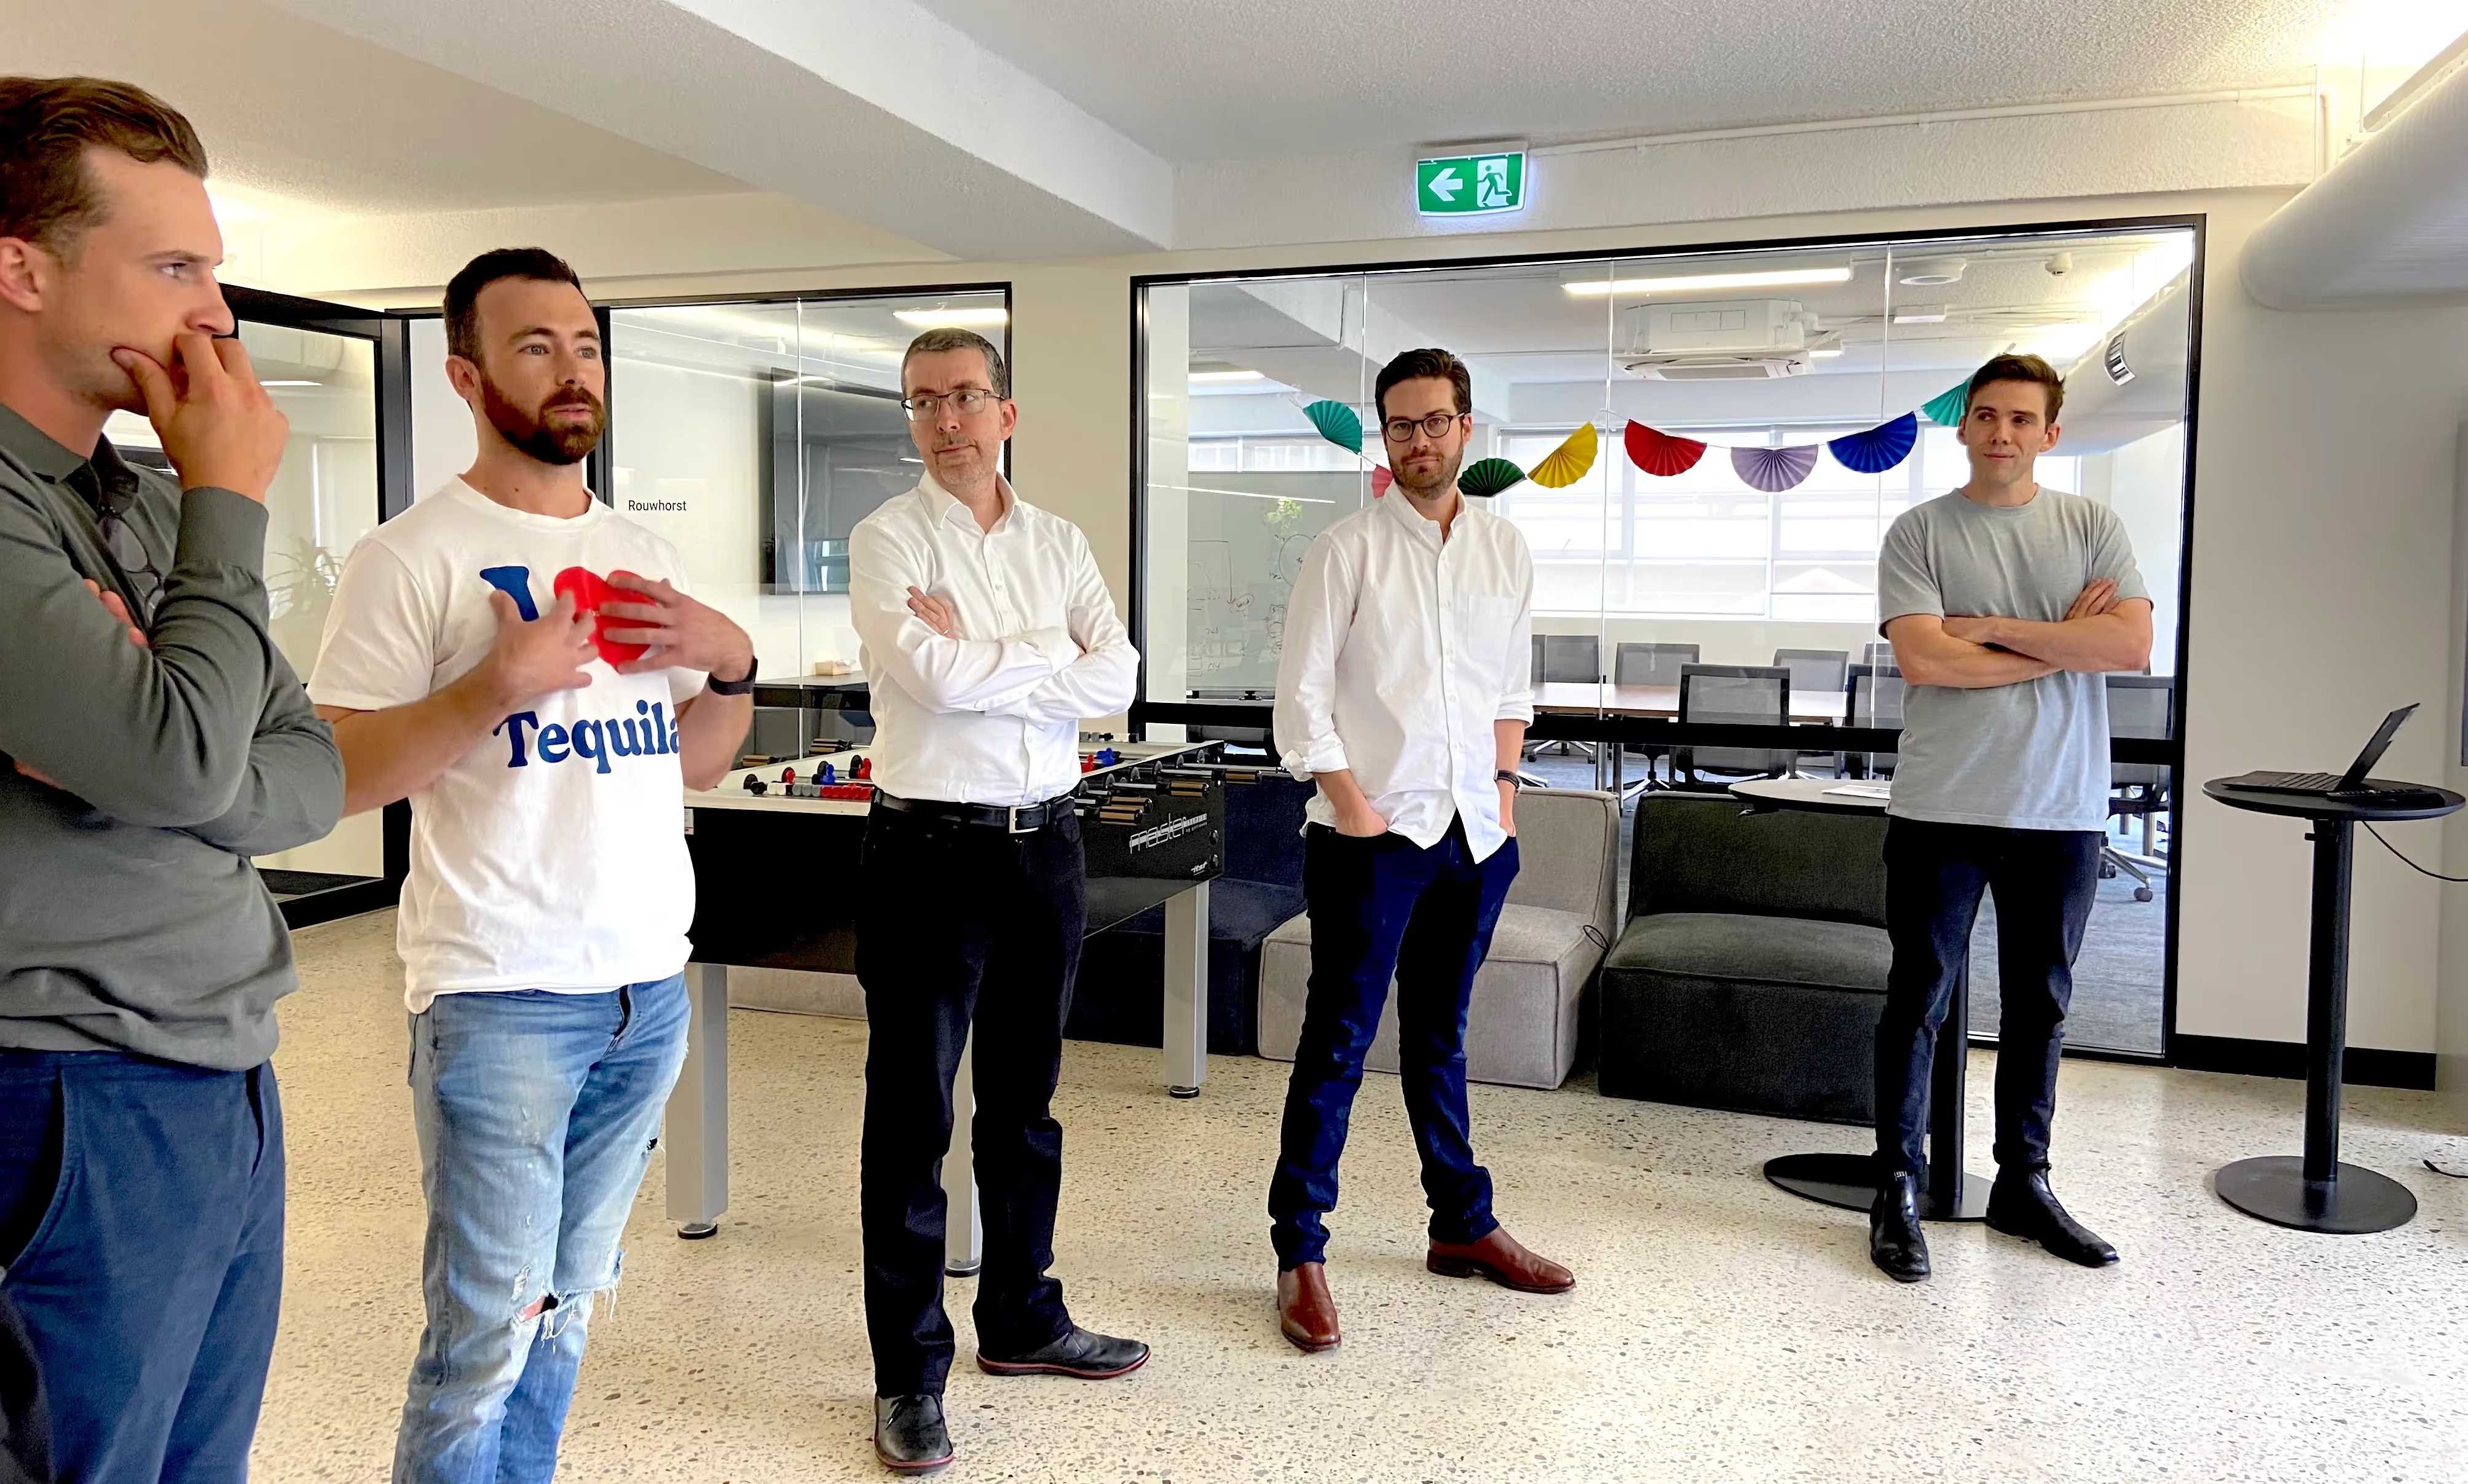
Behind the Curtain - Our Product, Design and Engineer Process
Arriving at this amazing new product has been a journey with countless hours of developer time and customer interviews in pursuit of our mission. From a product, design and engineering perspective, we delivered on this solution successfully and here is a glimpse of the whole process:
Build it once and build it good!
We came up with criteria using Productboard. We want to avoid committing to some tools that we later find out can’t do what we need. We concentrated on the things that are important to us — PDF exportability, UI consistency, Rich Text, flexibility, and customization. We reviewed heaps of tech, rejected off-the-shelf tools, and found a very cool drag-and-resize tool which started with building a skeleton and getting the team to review it.
Library approach and flexibility
We wanted users to generate customized reports by pulling in what they need from a library of components. We needed lots of these tiles to provide flexibility. At the same time, users should also be able to customize each tile. Everyone might be reporting on the cash flow, but not everyone would show it the same way.
Iterate fast and with customers
The team (based in Canberra, Australia and the Philippines) got together in Sydney for a face-to-face discussion regarding the dashboards. We broke down the transition into phases, made it tight, and got into the “Just ship it!” flow. Then our Alpha version was released!
We realized that extensive planning, though important, would only result in an "idea" rather than a "solution" without validation from actual users. This approach facilitated swift integration of numerous enhancements and provided the wider team with the opportunity to experience the updates in real-time. The Customer Success team was then empowered to showcase ongoing work to customers and receive early feedback.
Customer input
Our team swiftly cracked into the production stage and made rapid iterations with valuable input from our customers including Nomura, Newcastle Airport, Compass, KPMG, and McKinsey & Co. We were continually looking for the answers to:
Does this solve their problems? What’s missing? What do they want to see next? How can we improve?
Wrapping it all up!
If you're a PM Consultant or Asset Owner who wants to streamline their data collection, reporting and aggregation, this new custom dashboard and reporting solution will be the perfect tool for you.
We built it from the heart with our customers input and have delivered to the industry a user-friendly interface, customizable options, collaboration capabilities, and integration options - ideal for PMCs and Asset Owners of all sizes. If you're looking to improve operational efficiency or make better-informed decisions, be sure to check it out.
Stay tuned as this is just the beginning of the reporting revolution. To keep up with the pace of reporting maturity, we’ll continue expanding our library of components and platform integrations. Email us at https://www.mastt.com/contact if you want to learn more.

Written by
Stacey Cardoso
Stacey Cardoso is the Engineering Team Lead at Mastt, with over a decade of experience as a serial start-up developer. Stacey has played a pivotal role in leading productive, remote-first teams that consistently deliver solutions customers love. She’s passionate about creating great software through a supportive, happy development environment. With a BS in Computer Science degree from the University of the Philippines, Stacey has contributed to the success of several start-ups, including Caresharing and GitLab. Her leadership philosophy? Trust your team, support each other, and remember that mistakes are only opportunities to grow - just recover quickly and gracefully.


Contributions by

Project Report Template
Download this FREE Project Report Template to track progress, highlight issues, and give stakeholders clear insights for faster, more confident decisions.

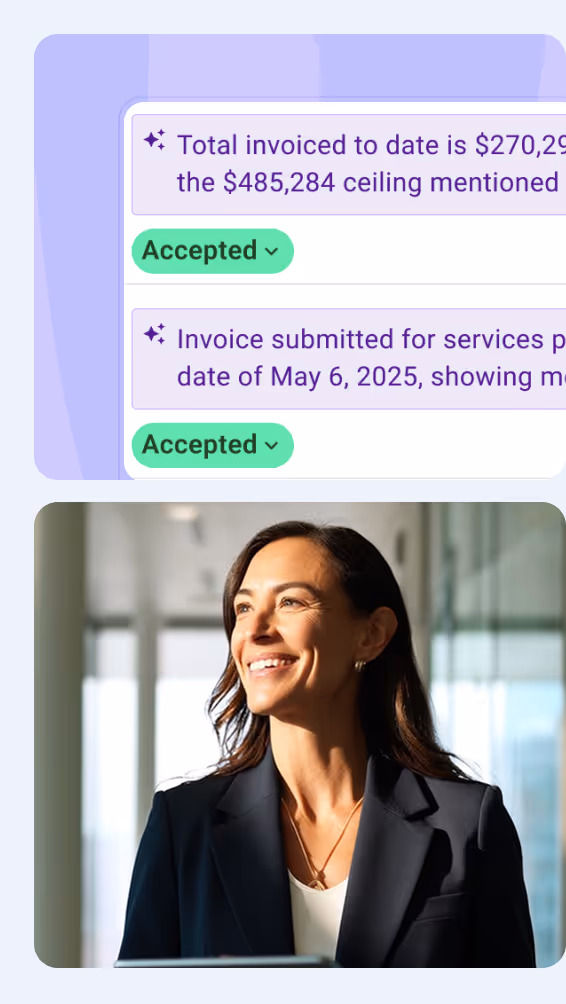
Walk Into Every Meeting With Confidence, Clarity, and Control
No one wants to look unprepared, blindsided, or uncertain in front of stakeholders — but that’s exactly what happens without Mastt.
Start for FreeTrusted by the bold, the brave, and the brilliant across governments, Fortune 500s, and the world’s best in delivering the future


.avif)