
Mastt’s construction reporting software turns scattered project data into meaningful visibility that supports confident decisions. Track cost, schedule and risk in one platform with accurate, reliable reporting.


Stop chasing project data scattered across emails, spreadsheets and disconnected tools. Construction reporting software brings every metric, milestone and decision point into one platform. You get visibility across cost, schedule and risk, so projects stay on track and stakeholders stay aligned.

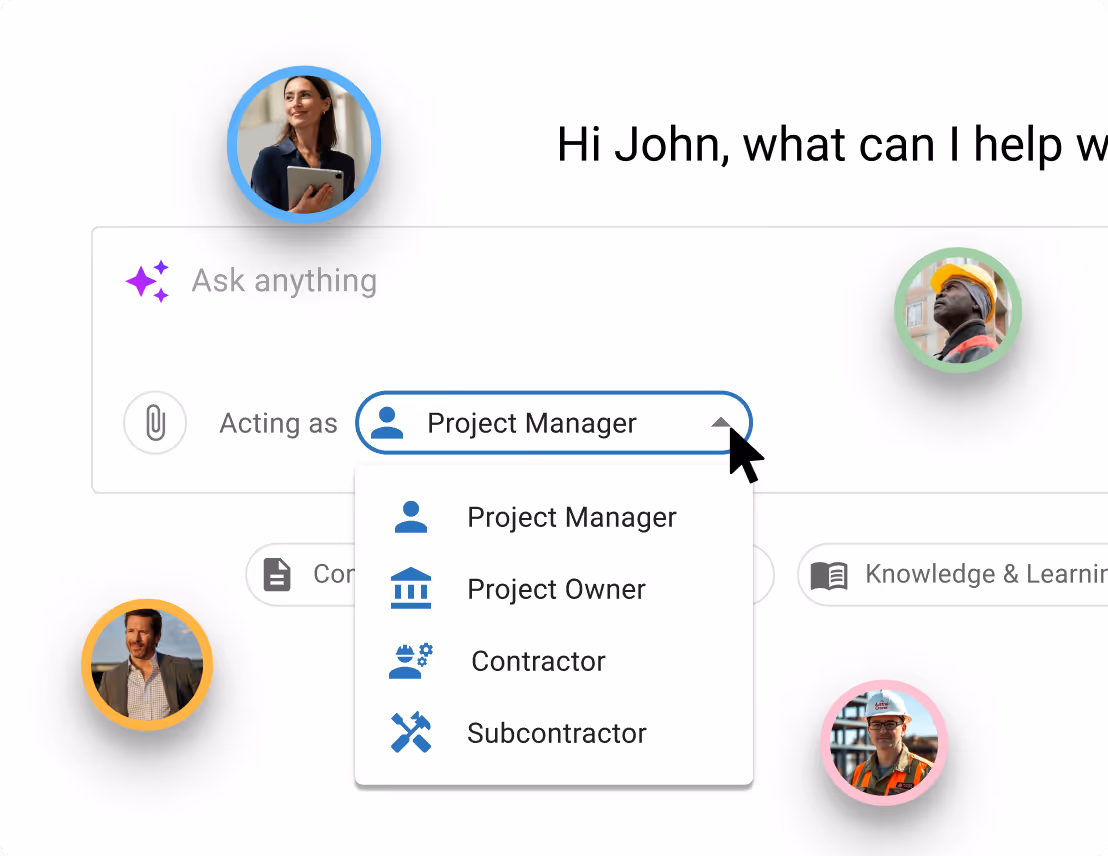
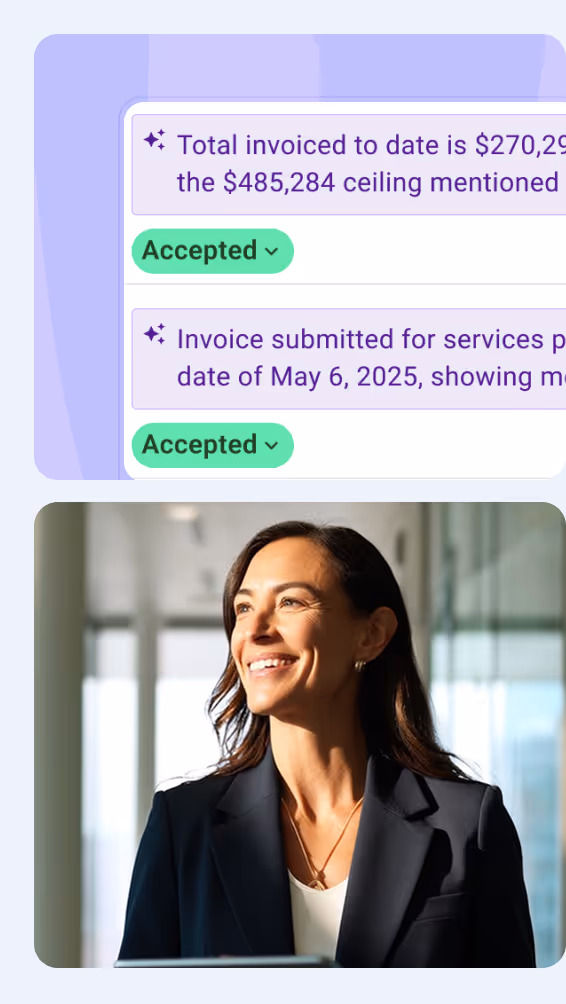
Stop spending hours creating reports when artificial intelligence can do it instantly. Chat with our AI to generate dashboard reports and automate financial data entry.
From analyzing complex project data to streamlining repetitive cost management tasks, our AI becomes your most valuable team member.
Explore All AI Features

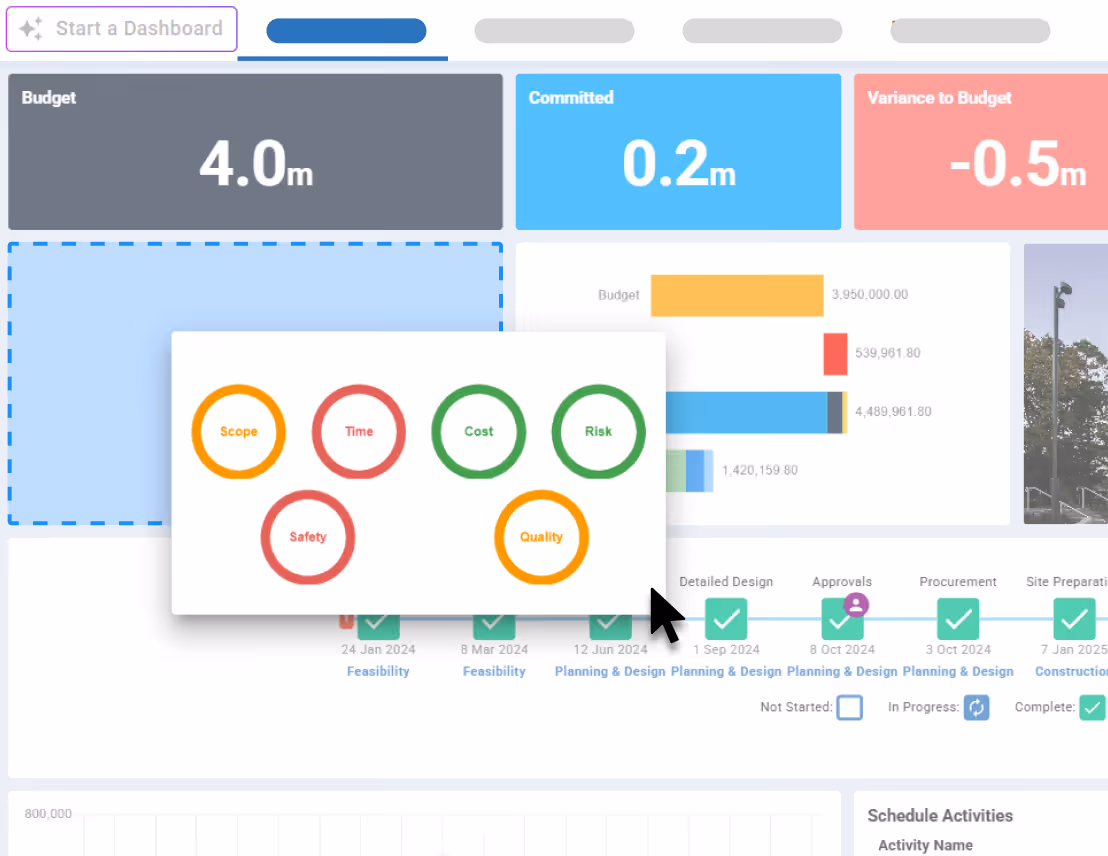
Every construction project is unique, and your project management dashboard should be too. Create multiple dashboard layouts tailored for different stakeholders - executives see high-level insights, project managers track critical metrics and clients receive a custom report.
Drag-and-drop widgets, custom KPIs, and create your own templates to build your competitive advantage one insight at a time.
Explore Dashboards
Managing multiple projects used to mean juggling multiple headaches. Now see project progress, budget health, and timeline status for your entire project portfolio in one glance. Build a management dashboard that updates in real-time as your teams log progress, expenses, and milestones.
Whether you're a project manager doing project tracking on a single build or an owner coordinating complex project portfolios, you'll always know where you stand and what needs attention next.
Explore Use Case

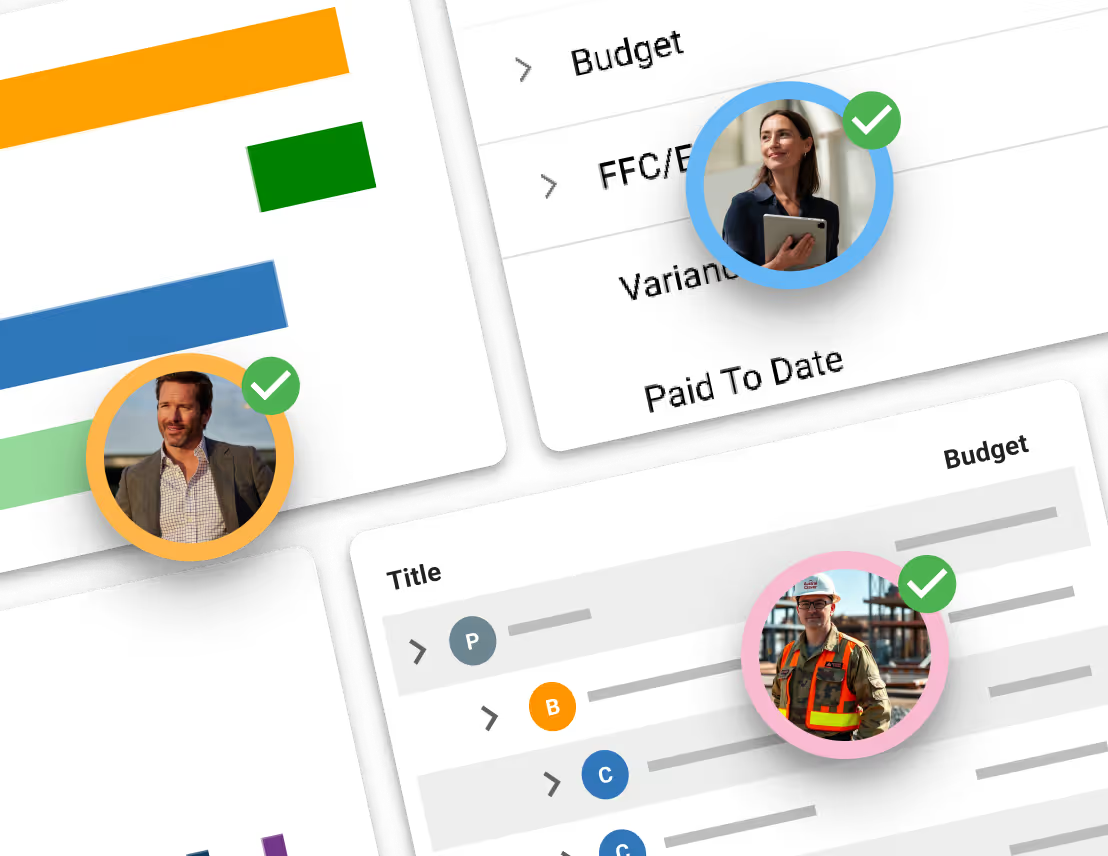
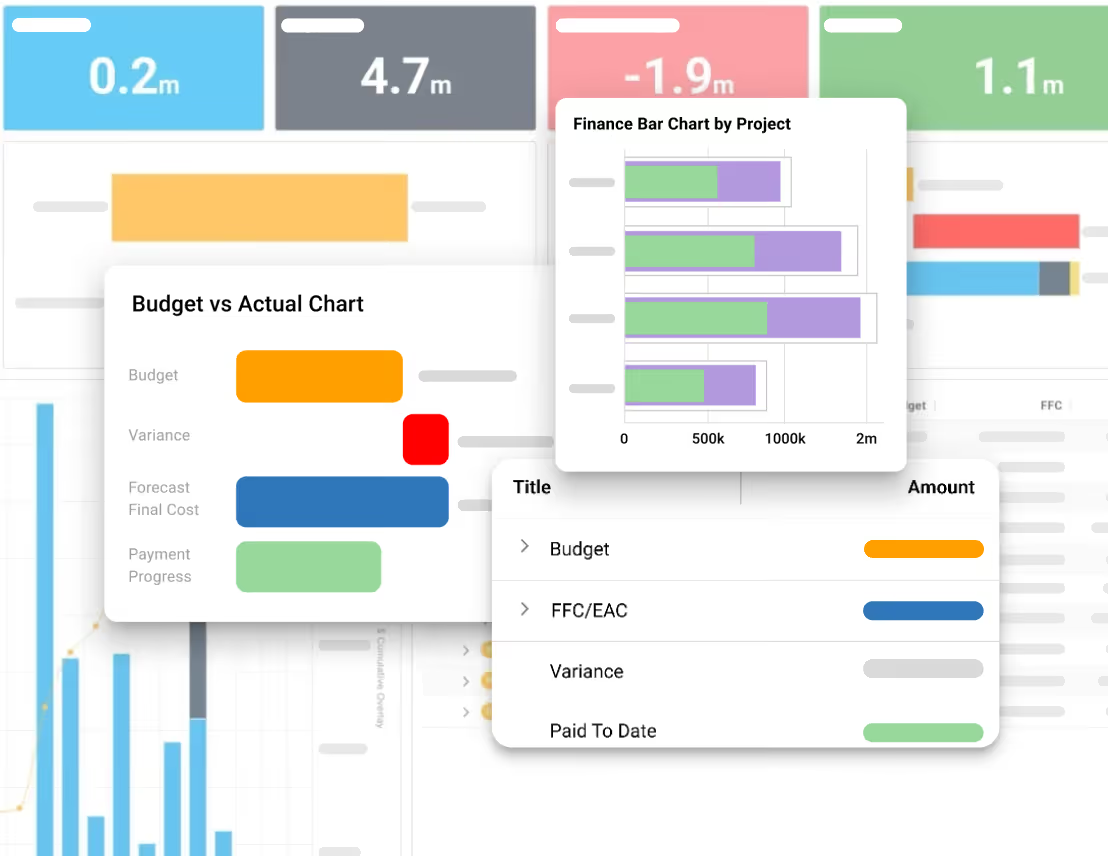
No one reads long, outdated monthly reports. With construction reporting software, you create clear dashboards that show budget vs actuals, timeline progress, risk status and key milestones.
Share project data that builds confidence, speeds approvals and keeps every stakeholder aligned. Turn reporting into a real advantage for every project.
See Pricing
See how construction project management professionals experience the rush of wielding true project power.
Read Case Studies

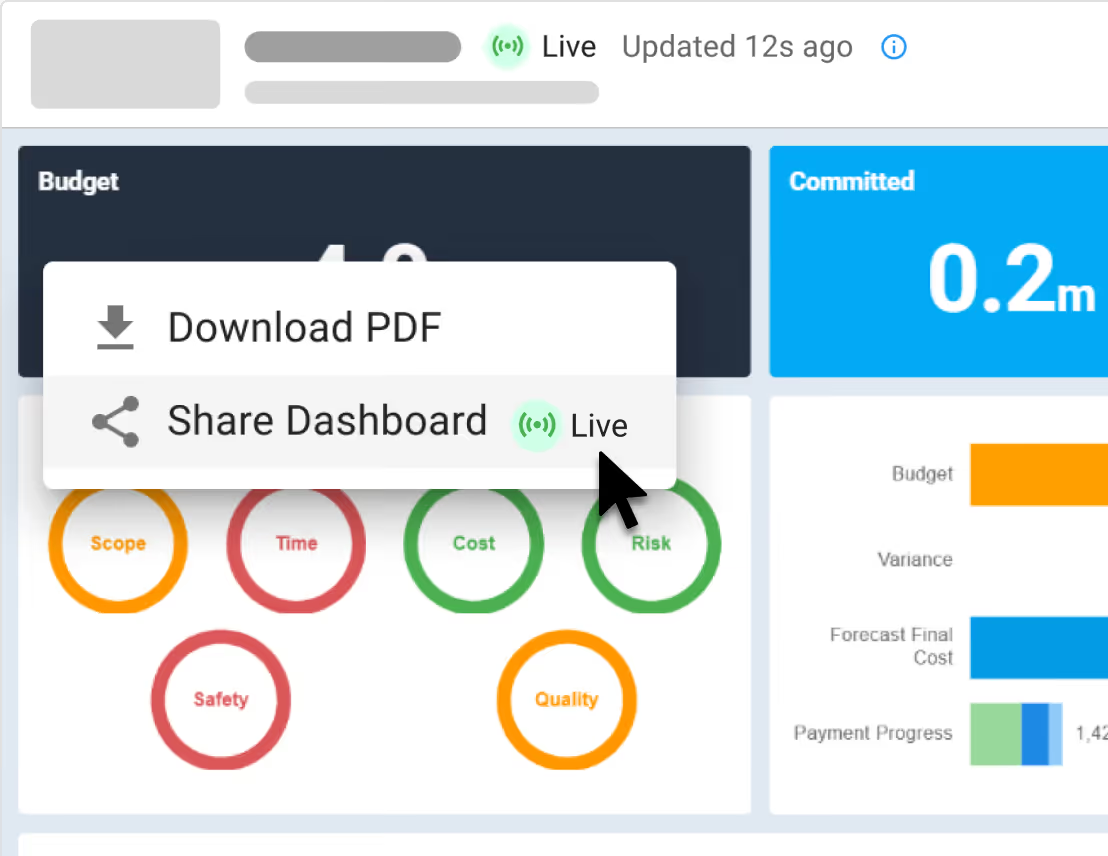
“Since moving to Mastt, we are able to report in real time so there's no delay in financial data being updated.”
Jacob Edwards, Funds Manager


Whether you're overseeing a single build or managing complex project portfolios, our construction software adapts to your role and responsibilities. From project managers tracking daily progress to executives monitoring portfolio performance, start impressing today.

Manage budgets, contracts and reporting across your construction portfolio with real-time visibility.
Learn more

Control budgets, payments and stakeholder reporting across every development.
Learn more

Standardize reporting and project controls, impress clients with real-time dashboards.
Learn more

Give clients confidence with real-time reporting and tighter control on every project.
Learn more

"Mastt has standardized our approach, making sure all of our reporting meets the same standards. Being live is great, clients have always got live data, rather than old data."
Luke Somerville, Managing Director
See Case Studies.webp)

Mastt’s construction reporting software brings every metric, milestone and data source into one platform. You track cost, schedule and risk with clarity while portfolios stay aligned and informed. Stakeholders see accurate information that speeds decisions and keeps project performance on track.

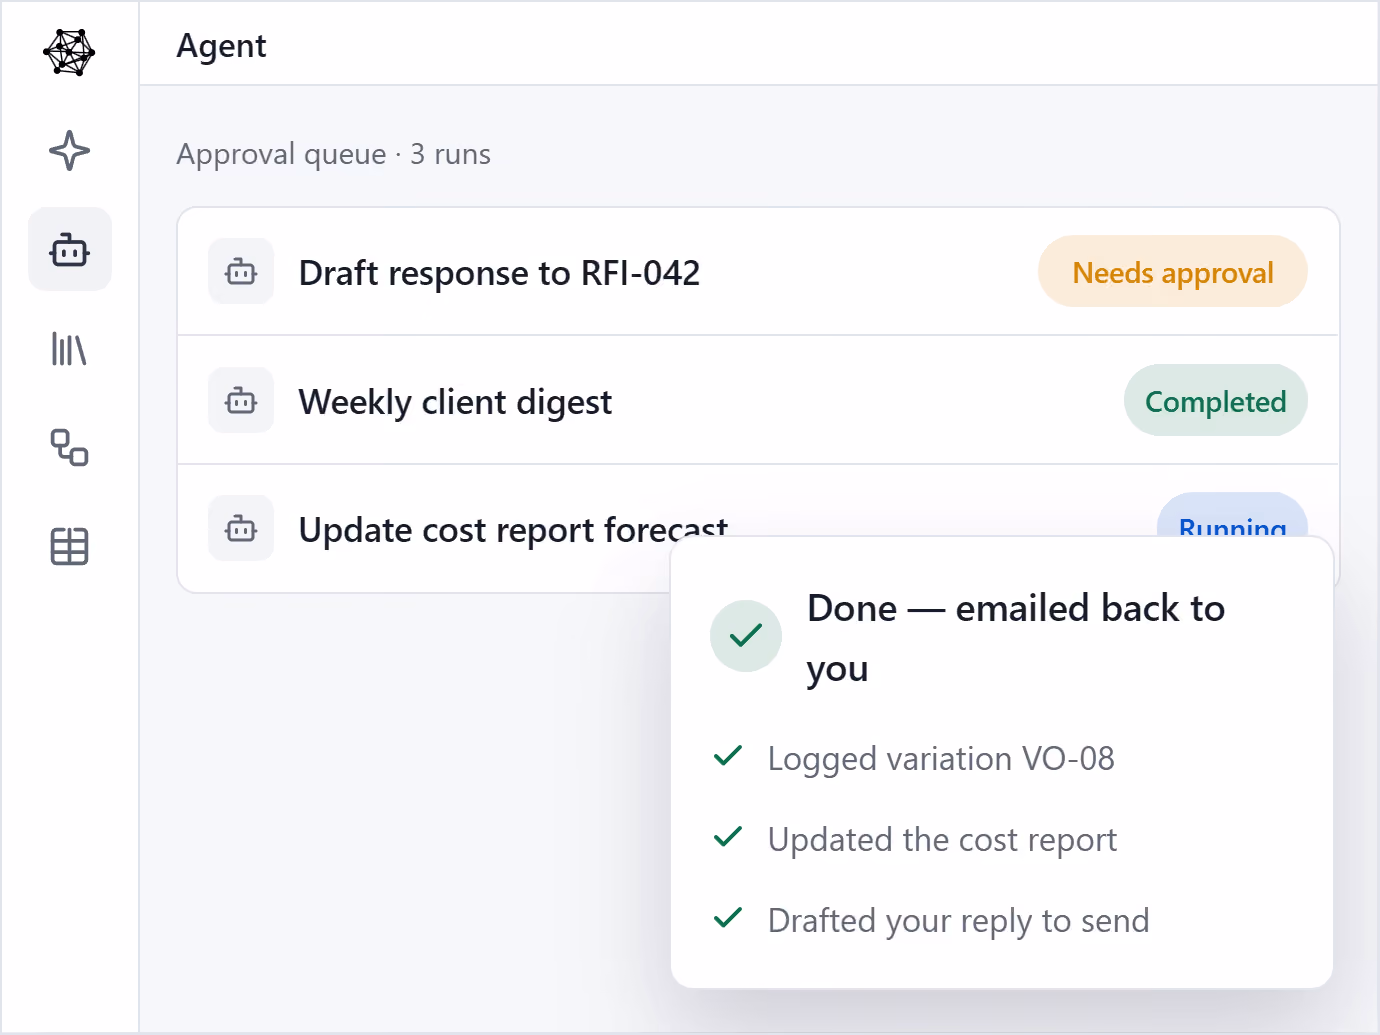
Multiply your people with AI Agents. Helps one person produce the output of many.

AI that knows your company’s templates, procedures and lessons learned.

Upload the templates you already use, and your AI Agent drafts on-brand, every time.

Set up a process once, and let Agent run it every time.

Keep track of projects with live, interactive reports 24/7. See rich, powerful visualizations.

Unify cost, risk, schedule, and reporting in a simple construction project controls system.

Easily invite team members and share project data in real time.

Automate repetitive tasks with Mastt’s AI data entry and template tools.
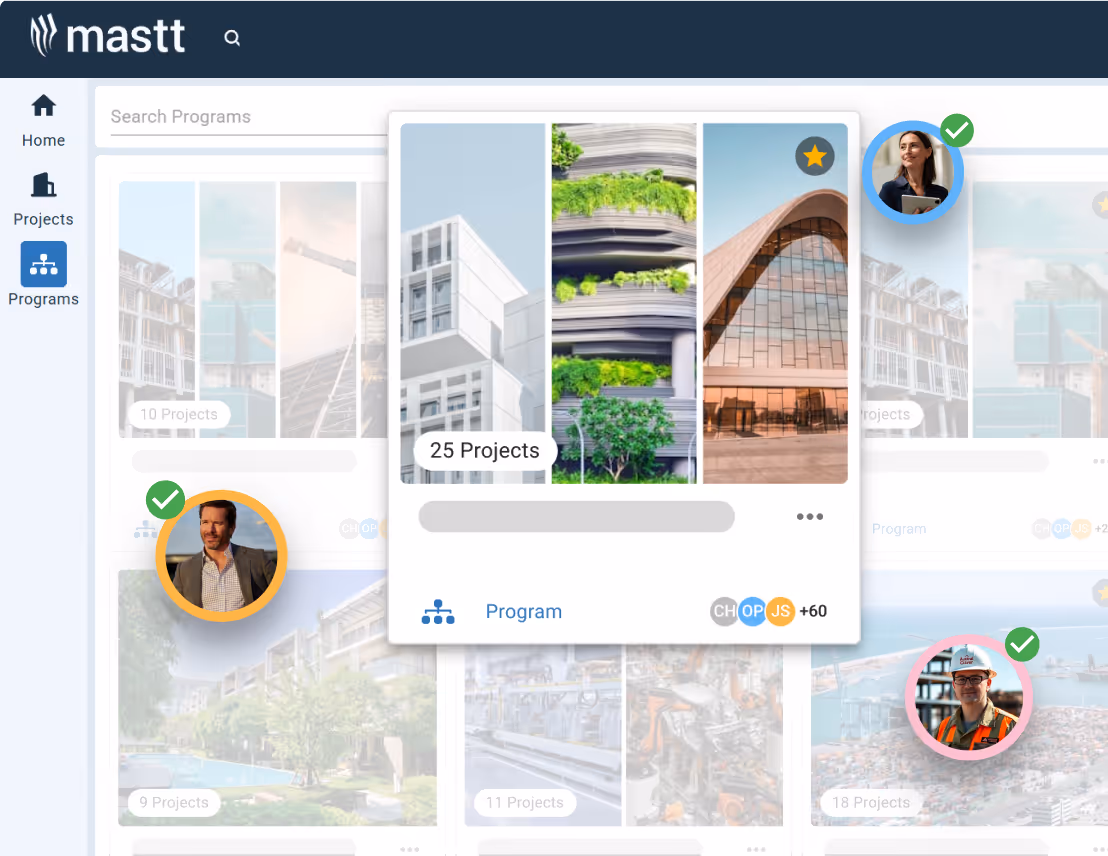
Mastt brings every project in your program into one clear, connected view.
Roll up cost, risk, schedule, and reporting from every project into one unified, real-time view.
Consistency across every project. Secure, centralized data, full audit trails, and real-time decision-making.
Mastt’s trusted AI eliminates the admin and manual standardization that slow your team down.
Keep track of projects with live, interactive reports 24/7
Fast & automated reports from project status to project portfolio reports
Capital project charts, maps, visualizations and other components out of the box!
Snapshot & store entire projects or reports for record keeping & compliance

Digital ledgers and smart forms for financial precision
Track costs back to budgets and see unders/overs
Centralize all contracts & payments back to budgets

Report on cash flow actuals, forecasts, and baselines
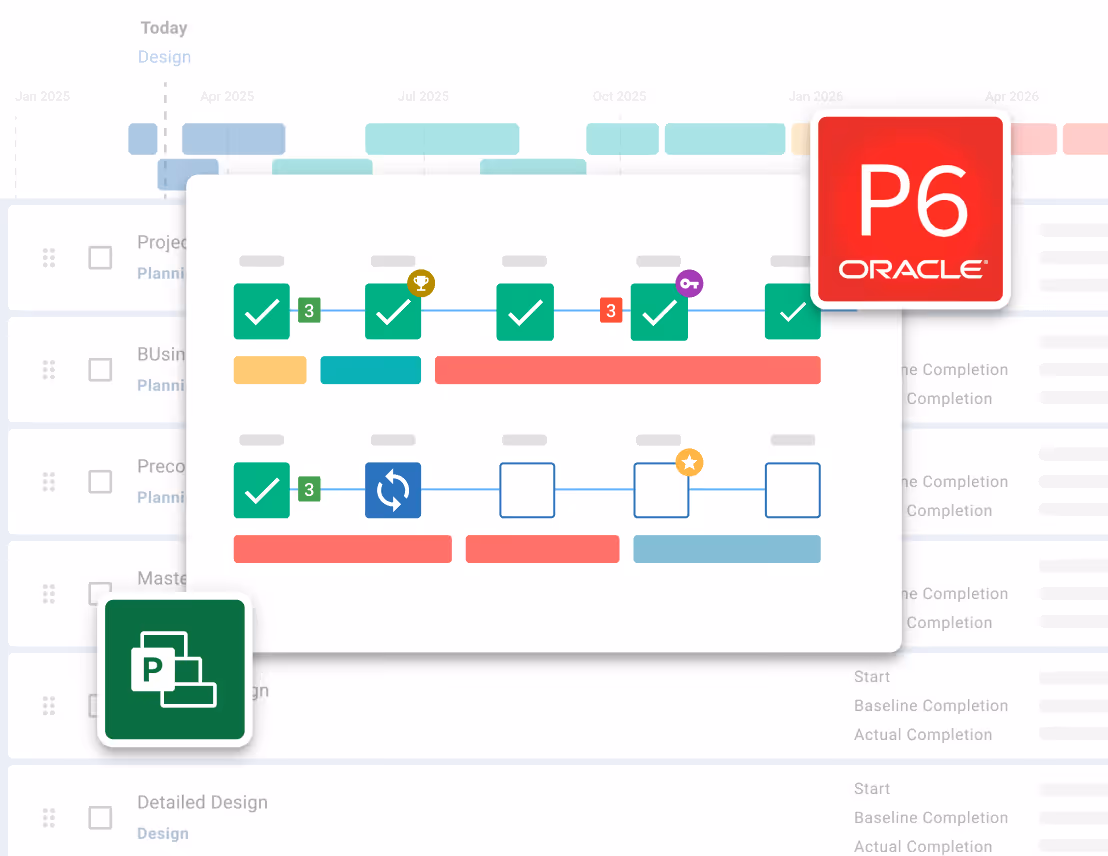
Manage the complete project lifecycle across your portfolio

Tracks your project through key milestones

Manage projects through clear phases, stages and gates
Measure performance of a portfolio of projects
Risk Management process made simple and configured to your likelihood & impact ratings
Streamline Risk Analysis on your 5x5 or 4x4 Risk Matrix and identify Treatments

Visualize Risks for fast, easy reporting and workshopping. Generate a Risk Register
Maintain Risk Registers at a Project or Program / Portfolio level


Store every contract, report and project file in one secure place.
Structure every project with clear, consistent folders your whole team can navigate.

Ask questions in plain English and get answers from your documents instantly.
See every document tied back to its source in your project - contract, payments, changes and more.
.avif)
Launch faster with proven dashboard layouts designed by construction industry experts. Choose from project planning templates, portfolio dashboard configurations, and stakeholder reporting formats that have delivered success across thousands of projects.
Built for construction project management, our reporting software tracks timelines, budgets and risks in one platform. Every feature connects seamlessly to create a complete solution your team will want to use every day.

Build dashboards with a ready-to-use library of charts and visualizations.
Learn more
Andrew Benn, WSP Technical Director
"With Mastt, our client can see the status of the project anytime, reducing back and forth queries, and not having to wait until the end of the month to receive a monthly report."
Read Case Study
Rebecca White, RPS Program Manager
"Mastt has saved our team significant time and effort in managing the financials elements of 65+projects. The team now has total visibility over their individual projects as well as the overarching program of works."
Read Case Study
Erik Maasepp, Capital Insight Senior Project Manager
"Mastt takes away a lot of user error that spreadsheets bring. With Mastt, we are able to combine multiple projects into programs or portfolios for management level analysis and direction."
Read Case Study
CAPT. Dan Foley, Army Digital Transformation Manager
"Mastt is increasing the team’s tempo and productivity by enabling real time information across our portfolio of projects. This transparency is assisting us to make informed decisions, to identify opportunities and reduce the risk."
Read Case Study
Dan Atkins, Jacobs National Program Manager
"Mastt's ability to record critical financial information as well as program forecasted delivery and milestones put Jacobs in a favourable position to our clients."
Read Case Study.webp)
Mohammed Salameh, Compass' Associate Director
"Moving to Mastt is one of the best decisions my team has ever made. It’s cost-effective, easy to use, and a quick set up."
Read Case Study.webp)
Fergus Bruce, Project Manager at WSP
"A key factor in our decision to adopt Mastt is its user-friendliness. It had to continue to empower us to work smart, allowing us to consistently deliver excellence across multiple sectors and geographic regions."
Read Case Study

Join thousands of construction professionals who've transformed their lives with our platform. From small project managers to enterprise capital projects, our customers consistently deliver projects on time and under budget.

We would encourage anyone in the project management sector to really look at this tool. We’ve had a fantastic time working with the team to deliver the best outcome for our business.

Chief Financial and Operating Officer
Mastt makes bad input much easier to catch, speeds up the data entry process, and gives us the tools to quickly interpret the status of our projects.

Project Manager
Mastt is a great solution to the issue of incomplete or redundant data used in project reporting. The fact that the data is in the cloud and able to be updated in real-time is a great benefit to me and my client's time.

Owner
Mastt has the power to combine multiple projects into programs or portfolios to filter data for management-level analysis and direction.

Associate Director
The ability to include specific requirements/information relevant to the project and the overall presentation of data on the system is first-rate.

Moving to Mastt is one of the best decisions my team has ever made. Mastt’s user-friendly interface makes it easy and fast for the project teams to update as things happen on-site.

Director
The platform is easy to use and interesting, and it has an appealing interface that clients like to look at and engage with.
Owner
Custom reporting solutions are a huge investment and not justifiable for most clients. We wanted something that had rules in place to ensure best-practice project management but still gave us the control to customise based on the clients’ and industry nuances. Mastt allowed us to do this.
Director
With Mastt, our client can see the status of the project anytime, reducing back-and-forth queries and not having to wait until the end of the month to receive a report.

Director
Mastt gives us transparency, more accurate data, and more confidence. It makes my life easier.

Business Manager
The data analysis and production of informative, easy-to-understand infographics are excellent for client communication and briefing and also allow for efficient and effective internal stakeholder meetings at various business management levels.

Associate Director
Great CAPEX management tool with intuitive infographics. The dashboard view of projects is something that we did not have before Mastt. I can see that it will deliver a clearer and more intuitive understanding of capital projects to executives.

Starter is free for your first project with no credit card required. Professional averages $165 per project per month. Enterprise pricing is custom for larger portfolios. Check out Mastt pricing page for complete details.
The Dashboards and Reporting help section has step-by-step setup guides for reporting, sharing, and exports. The Product Tour page also covers reporting workflows for a quick overview.
Yes. Mastt's AI supports faster dashboard creation and structured setup through AI Template Studio. More AI features are available across the Mastt AI product.
Yes. Client-ready dashboards are available for owners and stakeholders, with consistent reporting shared without rebuilding the same pack each cycle.
Yes. Dashboards and reports download as PDFs for sharing, and data exports to Excel aligned to the relevant reporting period. Mastt's link sharing feature also lets stakeholders view live project data through a secure web link without any file exports.
Yes. The same dashboard and report structure applies across many projects. Fields and layouts stay consistent across the portfolio for clean roll-ups and faster review cycles.
Yes. Report templates are created and reused across projects, with the same structure available for different teams and stakeholders. Templates are stored for repeatable reporting cycles.
Yes. Project dashboards are built for project status reporting and stakeholder updates, with the same layout reused each month. Reporting views stay aligned to your governance cadence.
Become superhuman with AI today. Free to start, simple to scale.

Your first project is on us — no credit card required. Get started instantly with core tools.
.svg)
Flexible month-to-month plan. Add projects as you grow and access free videos, training, and guides.
per month

Full enterprise features, advanced security, and dedicated human rollout support.

Agentic AI that gives humans an AI Agent counterpart to accelerate work, increase quality and boost output.
At Mastt, we’re building the world’s first Agentic AI for construction project teams
Used by project leaders building the future around the globe

.svg)
.svg)
.svg)
.svg)
.svg)


