

.avif)
Today I'm excited to unveil major updates of our Cost Module Overall page!
Back to 2019 when we first started, Mastt was launched around an initial niche goal to provide real-time project and program financial reporting in a new, transparent and automated way. Our first product had to be simple and solve a pain. So we decided to build a project cost tool that rolled up real-time data to a program level, with deep drill down capability. That was how the Cost Module was born!
The pièce de la résistance of the module was our Overall page - a world-first, innovative way to manage capital project finances. Anyone on the project could easily drill down to see detailed financial information, without looking at complicated formulas. Reports could be produced straight to PDF - bye-bye spreadsheets!
This new way of working enabled better, faster decisions and transparency that hadn't been seen in the project management consulting industry.
Overall Overhaul! More time saving, less time wasting
Three years on and we’re always in pursuit of perfection at Mastt. The team – myself, Dom, Ben, Dylan, John - saw significant value in re-designing a faster, better Overall page that provided users with new functionality to manage projects and met the needs of our maturing, tech savvy user base.
So we Overhauled the Overall and today we're deploying this world leading tool to our customers.
Now our customers can enjoy:
- 95% increase in speed
- 10x functionality
- Google level configurability
We’ve made a ton of improvements to achieve those stats! Here’s what's new in the Cost Overall page:
Building on the base of the Material UI design system (MUI), we have improved the visual style of the Overall view focussing on readability, accessibility and usability. With consideration of contrast, colour, icons, spacing, font weights and sizes, we’ve massively improved the page's overall look and feel and its table entities.
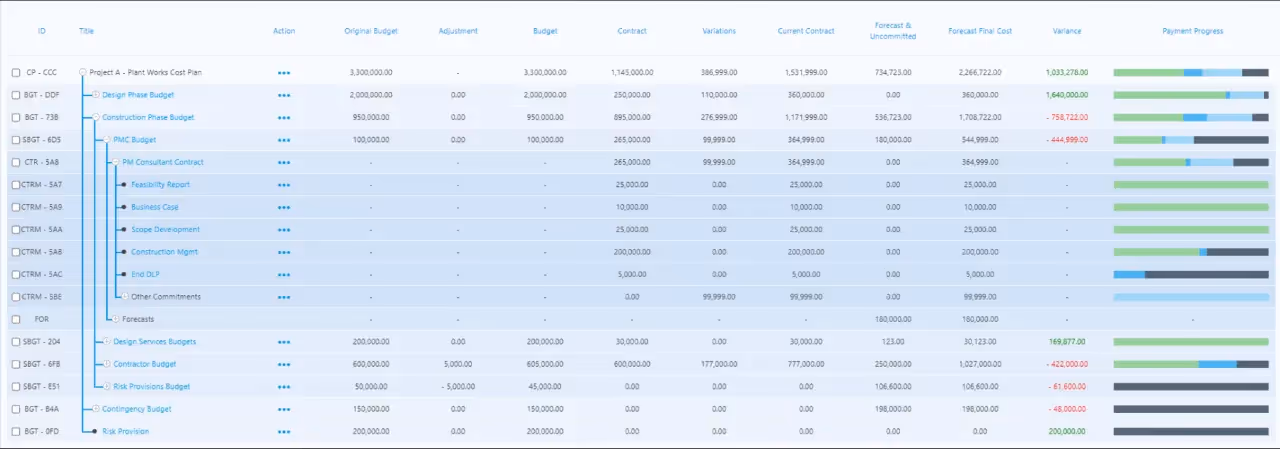
Different colours for different entities
The primary area of improvement is the distinguishing of each entity type (i.e. Budget, Contract, Variation, etc) to assist with scanning vast amounts of data on the screen.
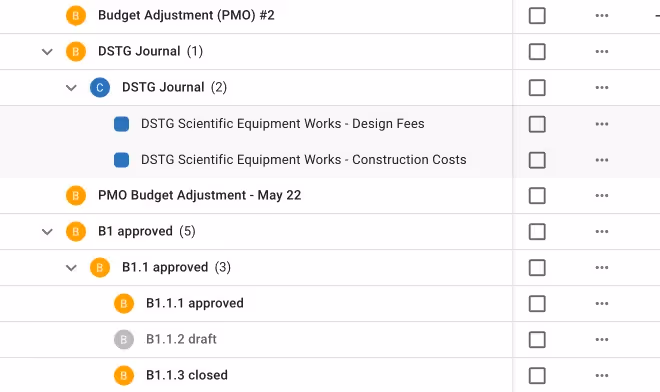
Each entity has been assigned a colour, which is presented via a small icon on the tree side of the row, as well as being used as a highlight colour when hovering the row. This allows simple association of the entity being viewed without a heavy cognitive load. It assists the eye to track across the row immediately.
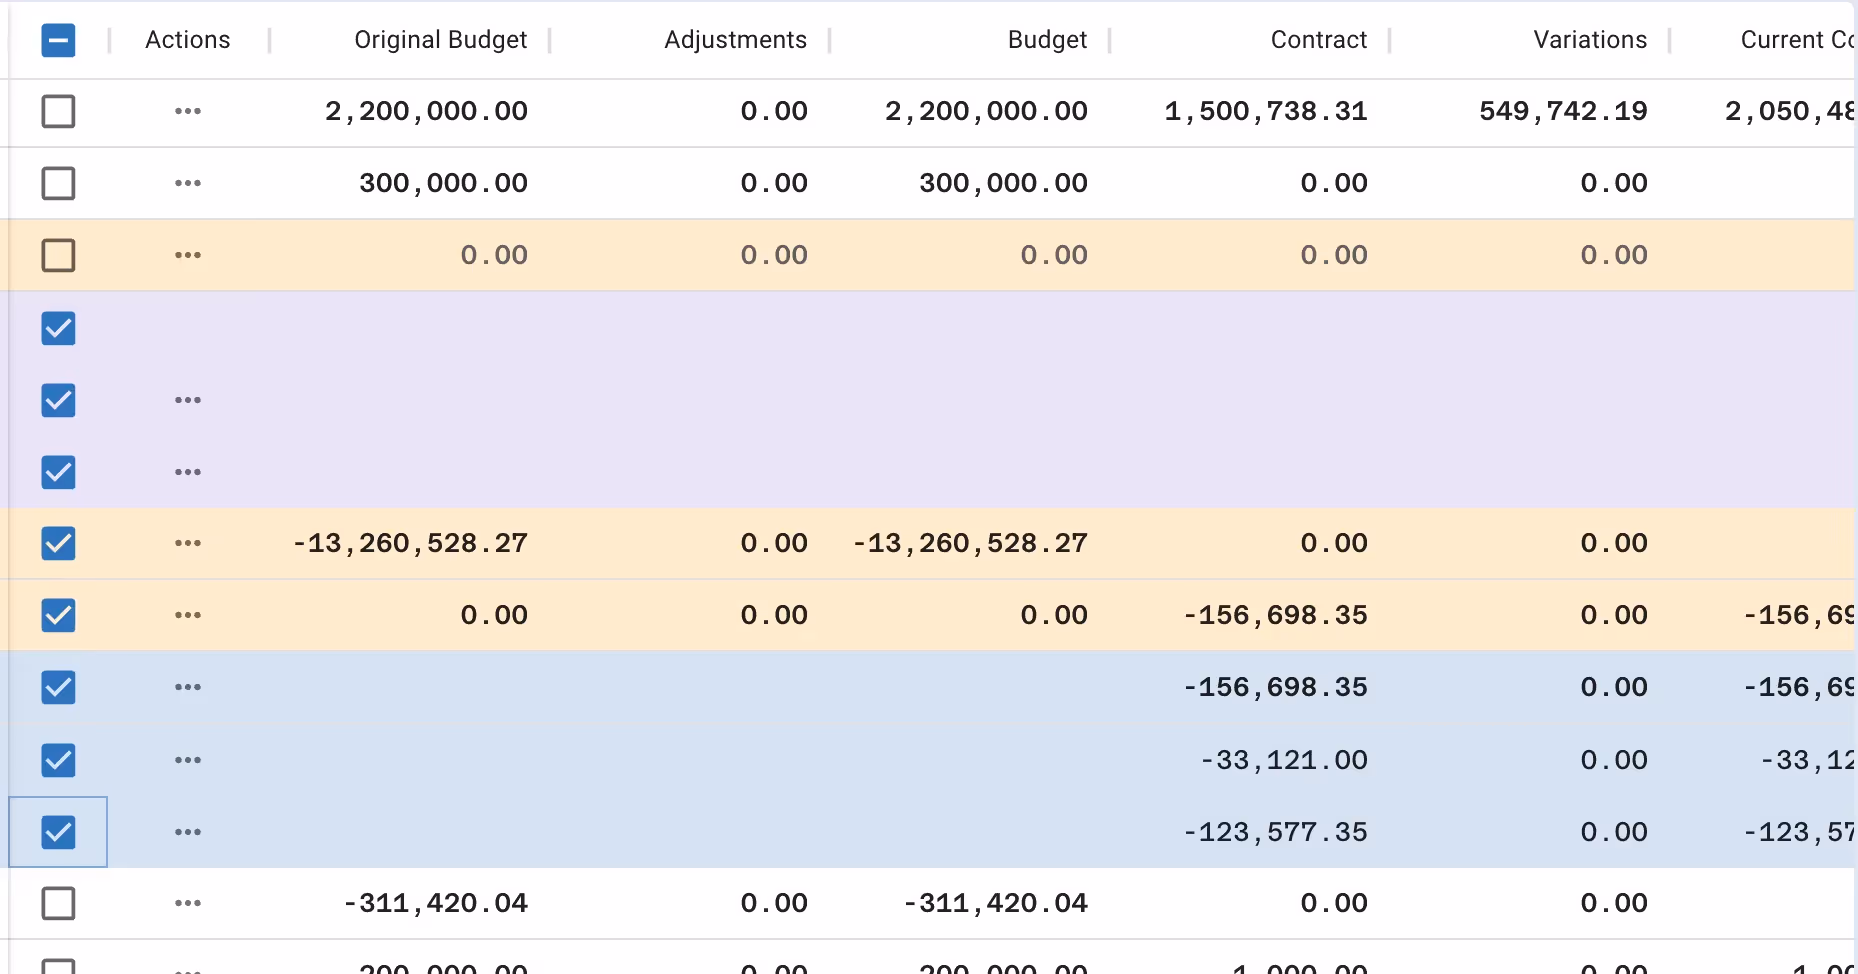
Additionally the numeric column data is now using a mono-spaced font across the app. Mono spacing means each number takes up the same horizontal width as its siblings, allowing a more consistent and readable experience horizontally and vertically.
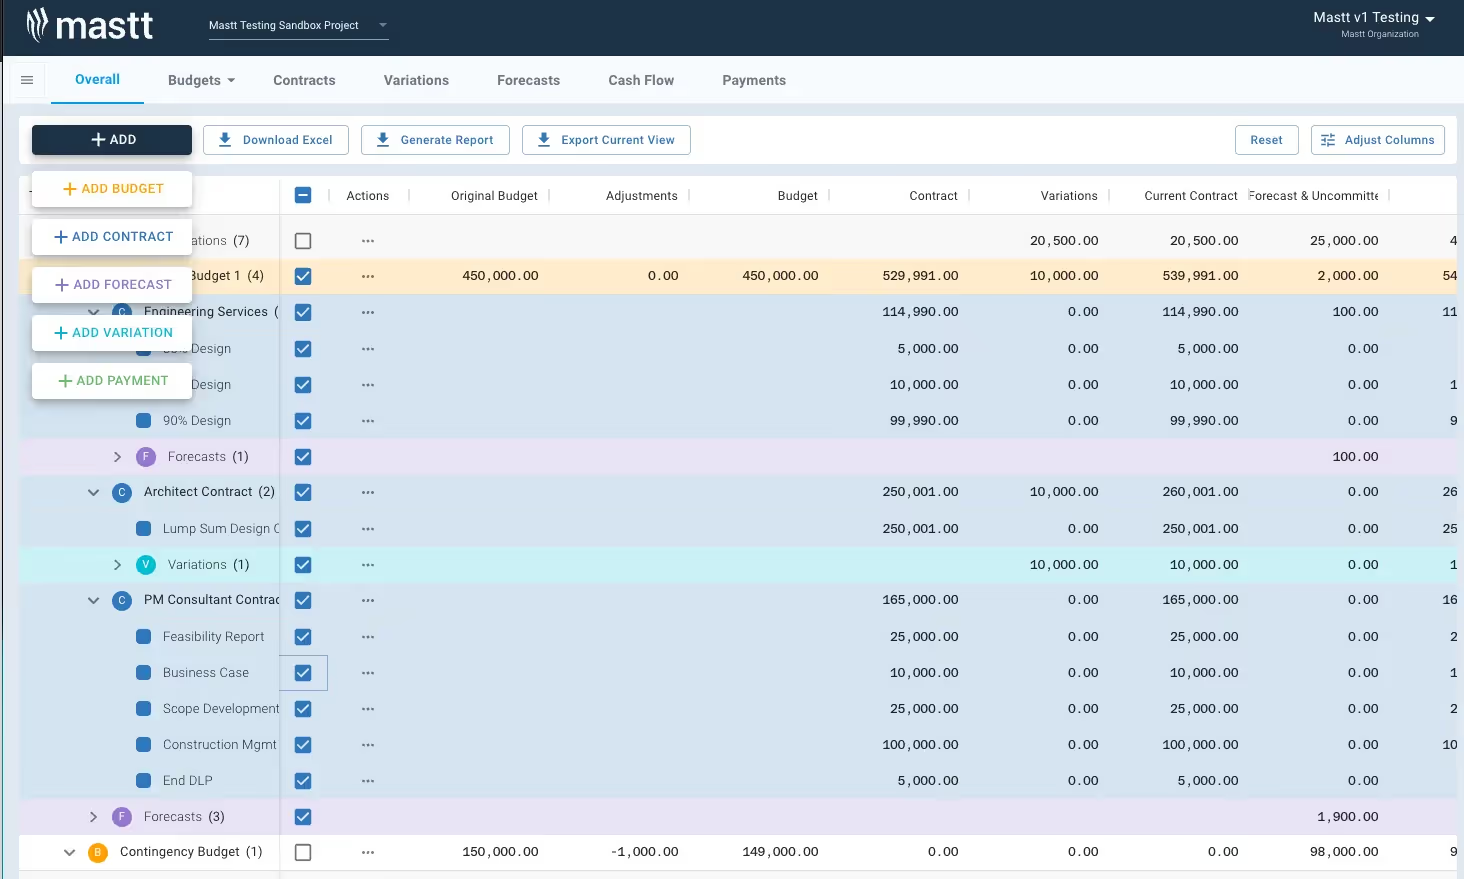
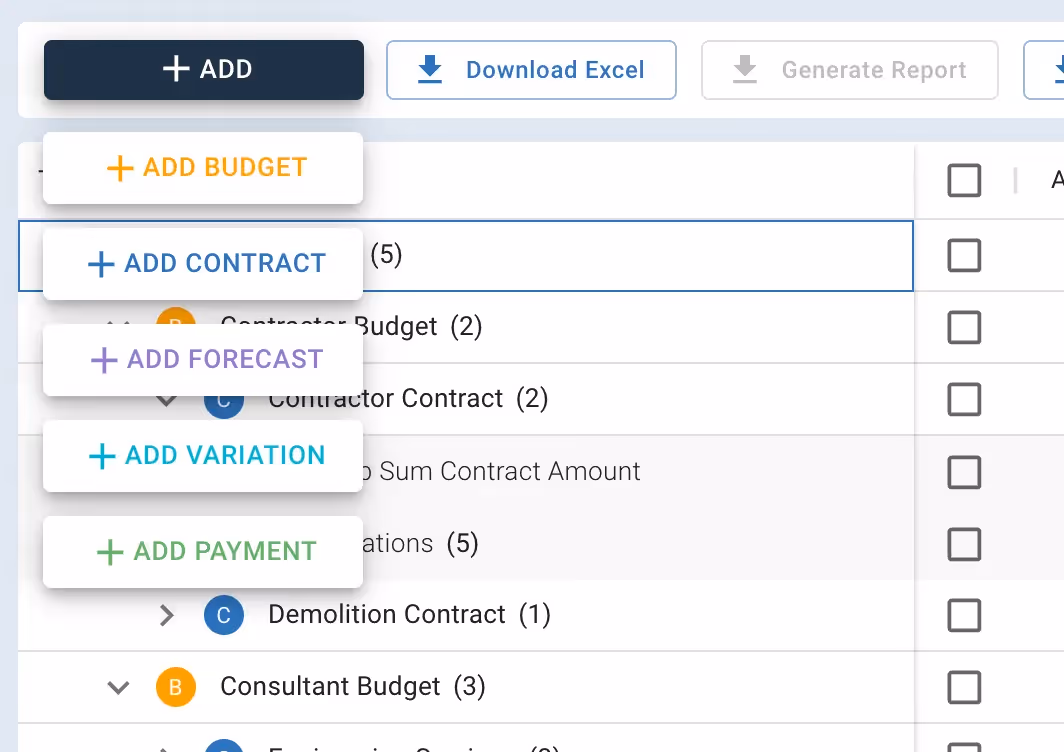
Speed Dial drop-down form
To help reduce the visual clutter in the Toolbar, we moved the Add buttons for each form up into a single Speed Dial component that drops down when hovered to expose buttons for each form. The Speed Dial acts as the "Floating Action Button" from MUI as it is the primary action for this page.
Decide how the columns look, your way!
We didn't just make changes to the look of the page. The new data grid allows you to do some really cool things with columns, like re-arranging, re-sizing, showing and hiding — all of which persists on reload, or if you navigate to another page, or come back in a month's time!
This persistence of state also applies to the unravelling of rows. So once you’ve set up the state of the table to the way you need it and like it, it stays that way. You can easily Reset the table to default if you need to.
We’ve removed the divider lines once you’ve unravelled to Contract level, and added a single level of depth shading, to indicate you’re inside a core entity. This distinction assists with keeping the table within accessibility contrast standards.
We’ve added some new columns that have been requested — specifically the breakdown of Payment Progress into 4 separate columns, in addition to the Payment Progress bar.
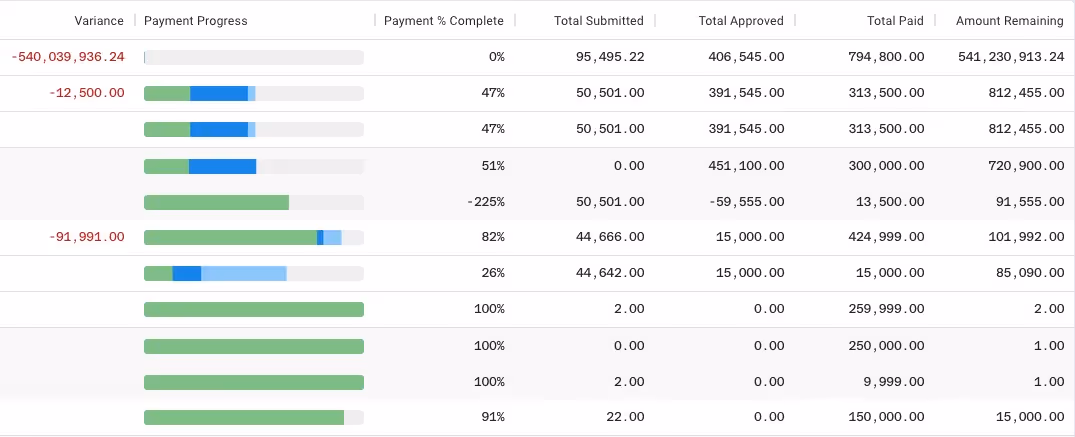
Lastly, there are tooltips that describe the calculation used when you hover a column header. Cool!
You can now copy and paste the cells from the table directly! Woohoo. There’s also a new feature - Export Current View - which allows you to dump the currently visible/unravelled rows and columns to a csv file.

Where to find more information
As always, if you find any of the information above unclear, you can see a detailed help page here, or contact me on hello@mastt.com. I'll be more than happy to answer your questions.
Have fun exploring your new Overall page.

Written by
Steve West
Steve West is a seasoned software engineer with over a decade of experience building fast, scalable web applications. He’s worked across startups, agencies, and enterprise teams, including a senior front-end role at Mastt. Today, he runs his own freelance practice, delivering high-performance websites with clean code and thoughtful UX.


Contributions by

Walk Into Every Meeting With Confidence, Clarity, and Control
No one wants to look unprepared, blindsided, or uncertain in front of stakeholders — but that’s exactly what happens without Mastt.
Start for FreeTrusted by the bold, the brave, and the brilliant across governments, Fortune 500s, and the world’s best in delivering the future