
Monitor project health across your portfolio with RAG status indicators.

Track project health across your portfolio with red, amber, and green reporting for the KPIs that matter. Add context, show changes over time, and help stakeholders understand where attention is needed.
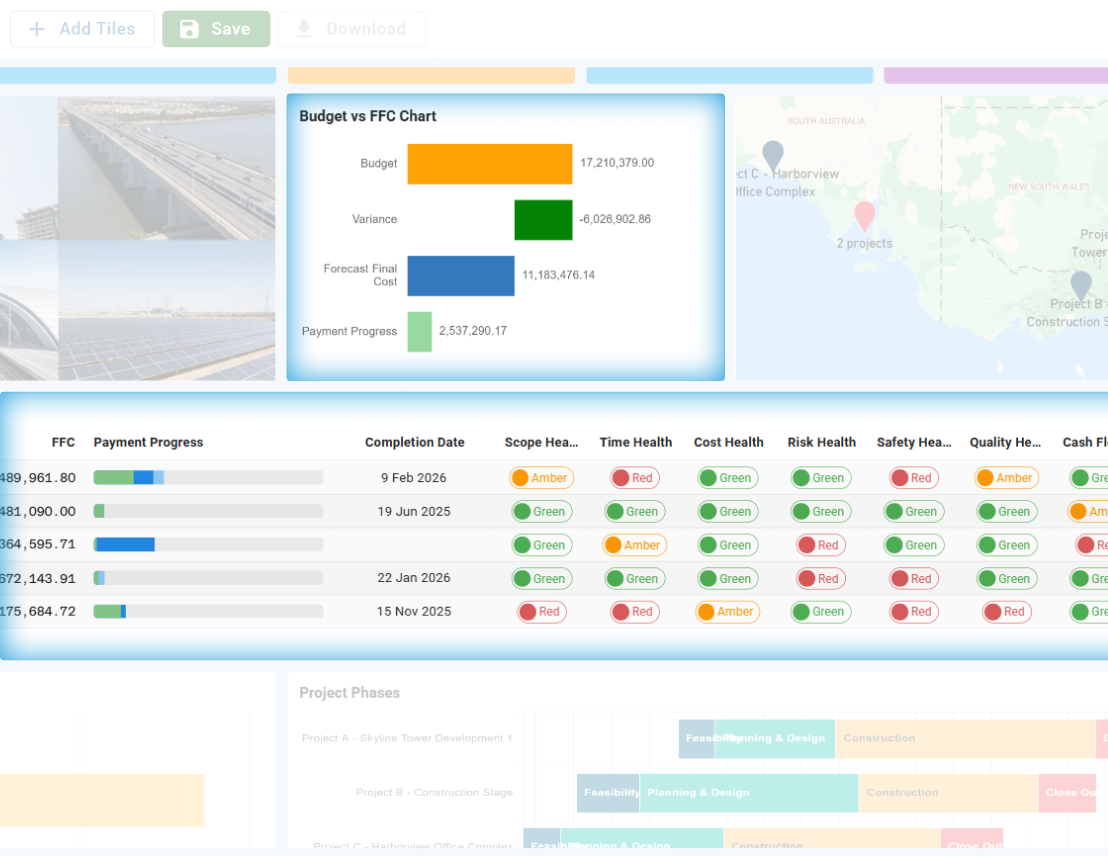
Monitor the project health indicators that matter most without building status reports from scratch. Health tiles let teams report across seven standard categories, so updates stay structured across projects and portfolios.
📊 Track scope, time, cost, risk, safety, quality, and cash flow.
🟢 Use red, amber, green, and blue statuses to reflect current health.
📁 Create executive dashboard views for clearer stakeholder reporting.
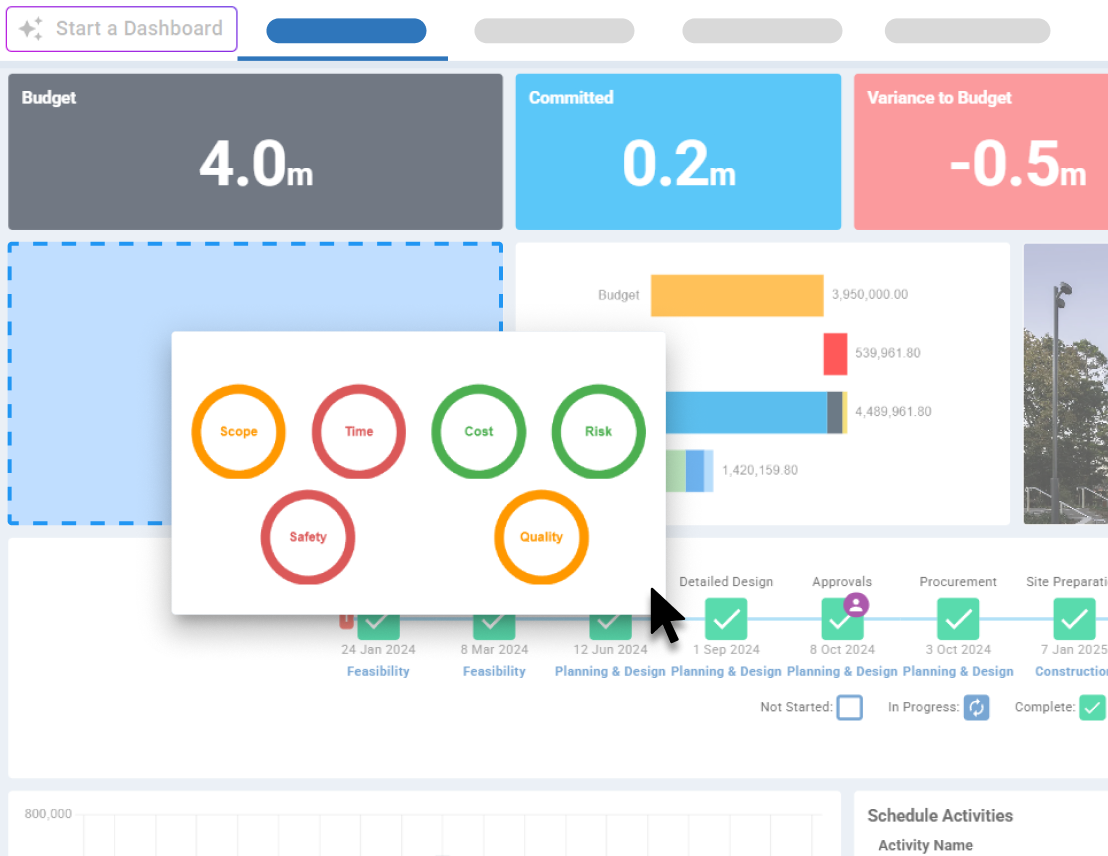
Turn status updates into a dashboard view that people can scan in seconds. Mastt includes health tiles designed for commentary, visual summaries, period comparisons, and trend tracking.
📄 Add detailed written commentary for one health category with the Health Text Tile.
⭕ Get a quick visual summary of overall project health with the Health Rings Tile.
🔄 See changes between two reporting periods with the Health Compare Tile.
📈 Follow project health over time with the Health Trend Tile.
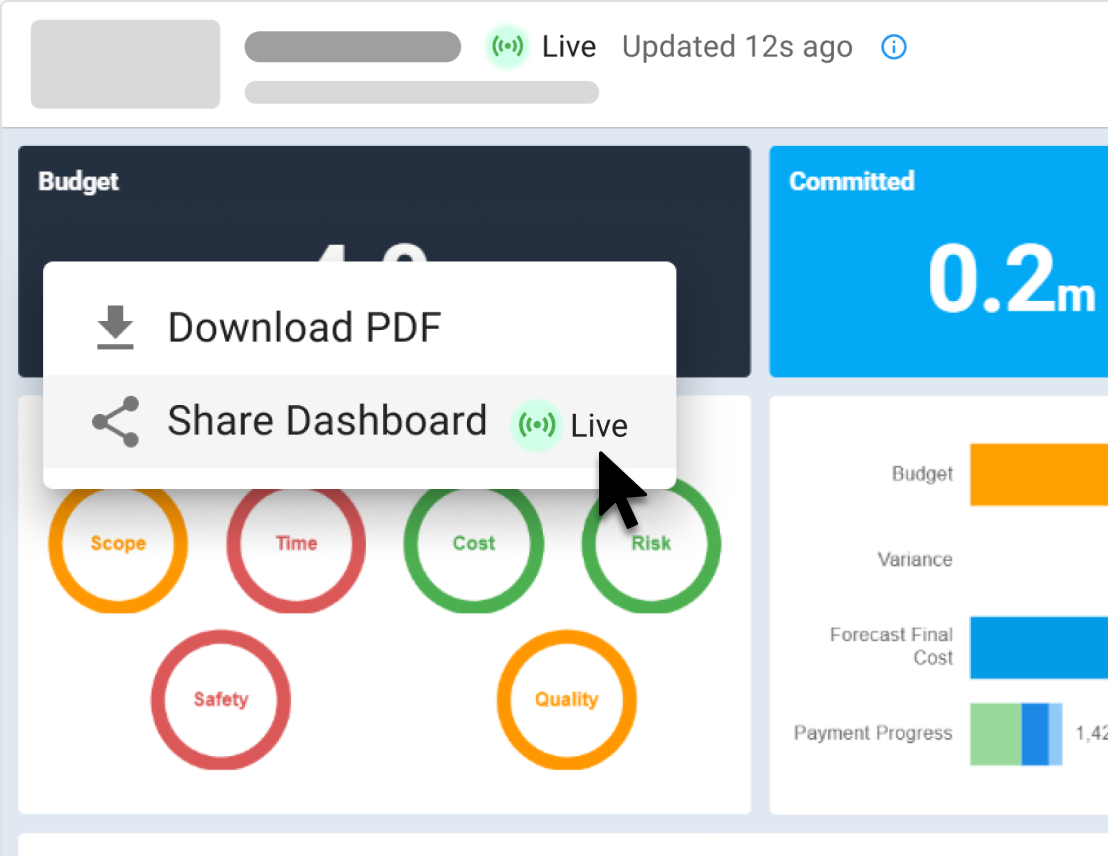
Help decision-makers review project status quickly and act sooner on emerging issues. Health dashboards bring structure to status reporting and make it easier to spot changes across reporting periods.
📅 Compare health updates across selected periods.
💬 Include commentary alongside period comparisons.
📉 Track historical trends using a chosen date range.
📤 Export dashboards as PDFs or share a link for easy access and distribution.
Become superhuman with AI today. Free to start, simple to scale.

Your first project is on us — no credit card required. Get started instantly with core tools.
.svg)
Flexible month-to-month plan. Add projects as you grow and access free videos, training, and guides.
per month

Full enterprise features, advanced security, and dedicated human rollout support.

Agentic AI that gives humans an AI Agent counterpart to accelerate work, increase quality and boost output.

Build dashboards with a ready-to-use library of charts and visualizations.
Learn more
Andrew Benn, WSP Technical Director
"With Mastt, our client can see the status of the project anytime, reducing back and forth queries, and not having to wait until the end of the month to receive a monthly report."
Read Case Study
Rebecca White, RPS Program Manager
"Mastt has saved our team significant time and effort in managing the financials elements of 65+projects. The team now has total visibility over their individual projects as well as the overarching program of works."
Read Case Study
Erik Maasepp, Capital Insight Senior Project Manager
"Mastt takes away a lot of user error that spreadsheets bring. With Mastt, we are able to combine multiple projects into programs or portfolios for management level analysis and direction."
Read Case Study
CAPT. Dan Foley, Army Digital Transformation Manager
"Mastt is increasing the team’s tempo and productivity by enabling real time information across our portfolio of projects. This transparency is assisting us to make informed decisions, to identify opportunities and reduce the risk."
Read Case Study
Dan Atkins, Jacobs National Program Manager
"Mastt's ability to record critical financial information as well as program forecasted delivery and milestones put Jacobs in a favourable position to our clients."
Read Case Study.webp)
Mohammed Salameh, Compass' Associate Director
"Moving to Mastt is one of the best decisions my team has ever made. It’s cost-effective, easy to use, and a quick set up."
Read Case Study.webp)
Fergus Bruce, Project Manager at WSP
"A key factor in our decision to adopt Mastt is its user-friendliness. It had to continue to empower us to work smart, allowing us to consistently deliver excellence across multiple sectors and geographic regions."
Read Case Study


