
Configure dashboards, charts, and tables to suit your reporting needs.

Customize your reports and dashboards to your taste and brand. Configure dashboards, fields, and layouts so project data reflects your reporting needs.
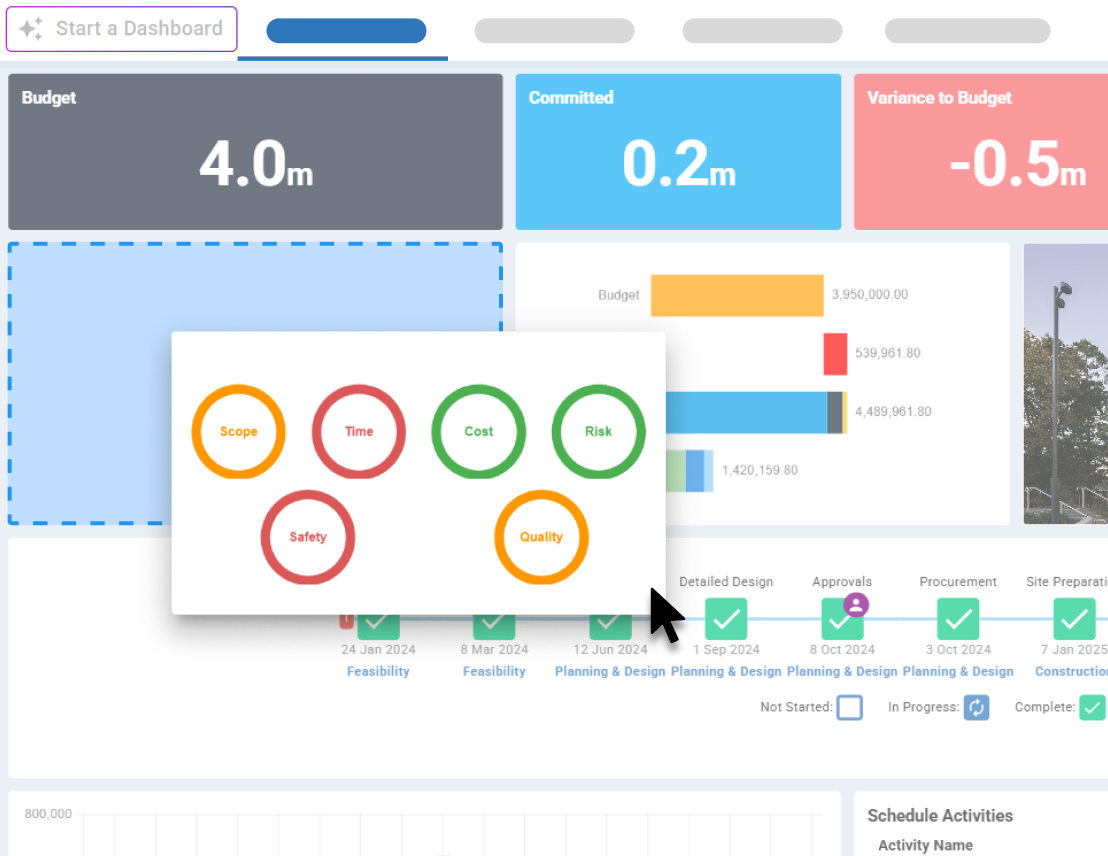
Customize dashboard layouts and visual components to suit different project reporting requirements. Adjust layouts, visuals, and display settings directly inside the Mastt dashboard builder.
🧩 Select portrait or landscape layout to match your reporting format.
📊 Resize charts, tables, and visuals to control how information appears on the page.
🎨 Change colors to align dashboards with company branding or highlight key project data.
👁 Toggle chart elements on or off to simplify visuals and focus attention on critical insights.
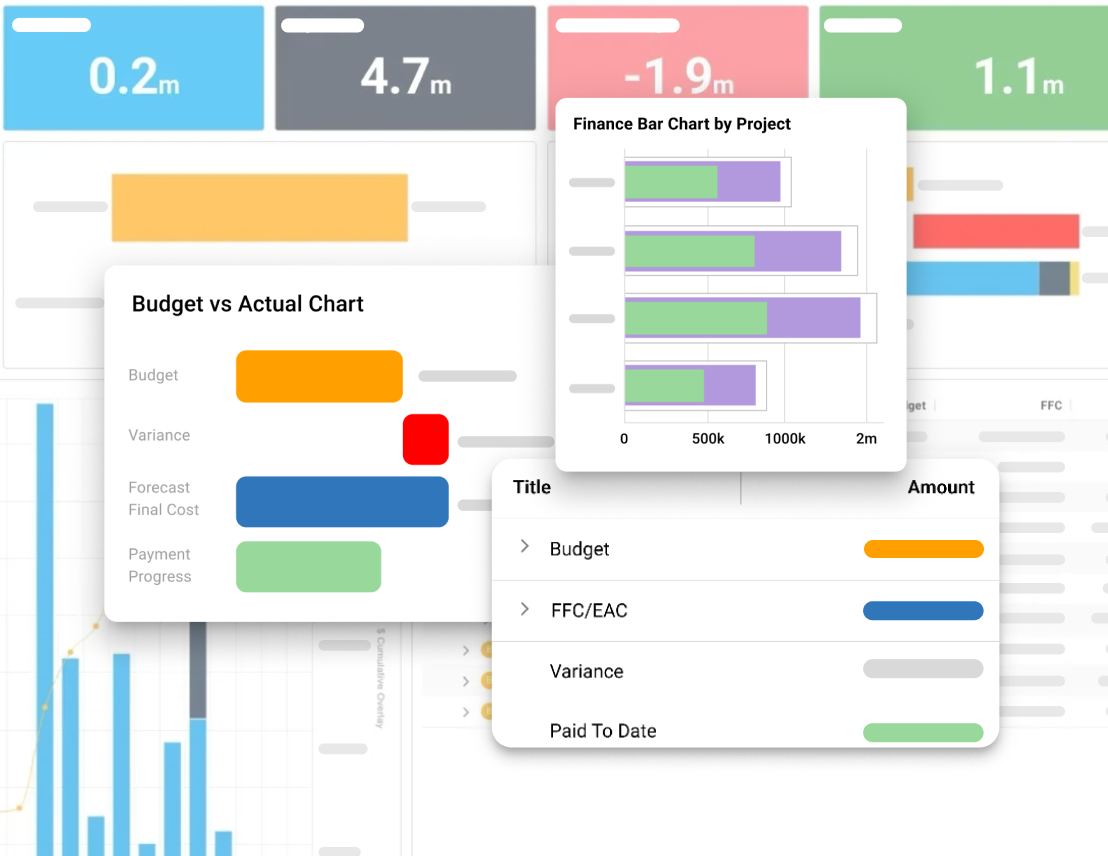
Use dashboard customization tools to surface important project metrics and structure reports for different audiences. Create clear views for executive reporting, project reviews, or portfolio monitoring.
📌 Call out key metrics so important numbers remain visible during project reviews.
📄 Build multi-page dashboards to present more information without crowding a single view.
🖥 Switch between dashboard, presentation, and print preview modes for different reporting contexts.
📈 Present clear visual summaries of project data for leadership teams and stakeholders.
Become superhuman with AI today. Free to start, simple to scale.

Your first project is on us — no credit card required. Get started instantly with core tools.
.svg)
Flexible month-to-month plan, payable by credit card. Add projects as you grow and access free videos, training, and guides.
per month

Full enterprise features, advanced security, and dedicated human rollout support.

Build dashboards with a ready-to-use library of charts and visualizations.
Learn more
Andrew Benn, WSP Technical Director
"With Mastt, our client can see the status of the project anytime, reducing back and forth queries, and not having to wait until the end of the month to receive a monthly report."
Read Case Study
Rebecca White, RPS Program Manager
"Mastt has saved our team significant time and effort in managing the financials elements of 65+projects. The team now has total visibility over their individual projects as well as the overarching program of works."
Read Case Study
Erik Maasepp, Capital Insight Senior Project Manager
"Mastt takes away a lot of user error that spreadsheets bring. With Mastt, we are able to combine multiple projects into programs or portfolios for management level analysis and direction."
Read Case Study
CAPT. Dan Foley, Army Digital Transformation Manager
"Mastt is increasing the team’s tempo and productivity by enabling real time information across our portfolio of projects. This transparency is assisting us to make informed decisions, to identify opportunities and reduce the risk."
Read Case Study
Dan Atkins, Jacobs National Program Manager
"Mastt's ability to record critical financial information as well as program forecasted delivery and milestones put Jacobs in a favourable position to our clients."
Read Case Study.webp)
Mohammed Salameh, Compass' Associate Director
"Moving to Mastt is one of the best decisions my team has ever made. It’s cost-effective, easy to use, and a quick set up."
Read Case Study.webp)
Fergus Bruce, Project Manager at WSP
"A key factor in our decision to adopt Mastt is its user-friendliness. It had to continue to empower us to work smart, allowing us to consistently deliver excellence across multiple sectors and geographic regions."
Read Case Study


