


What is a 5x5 Risk Matrix?
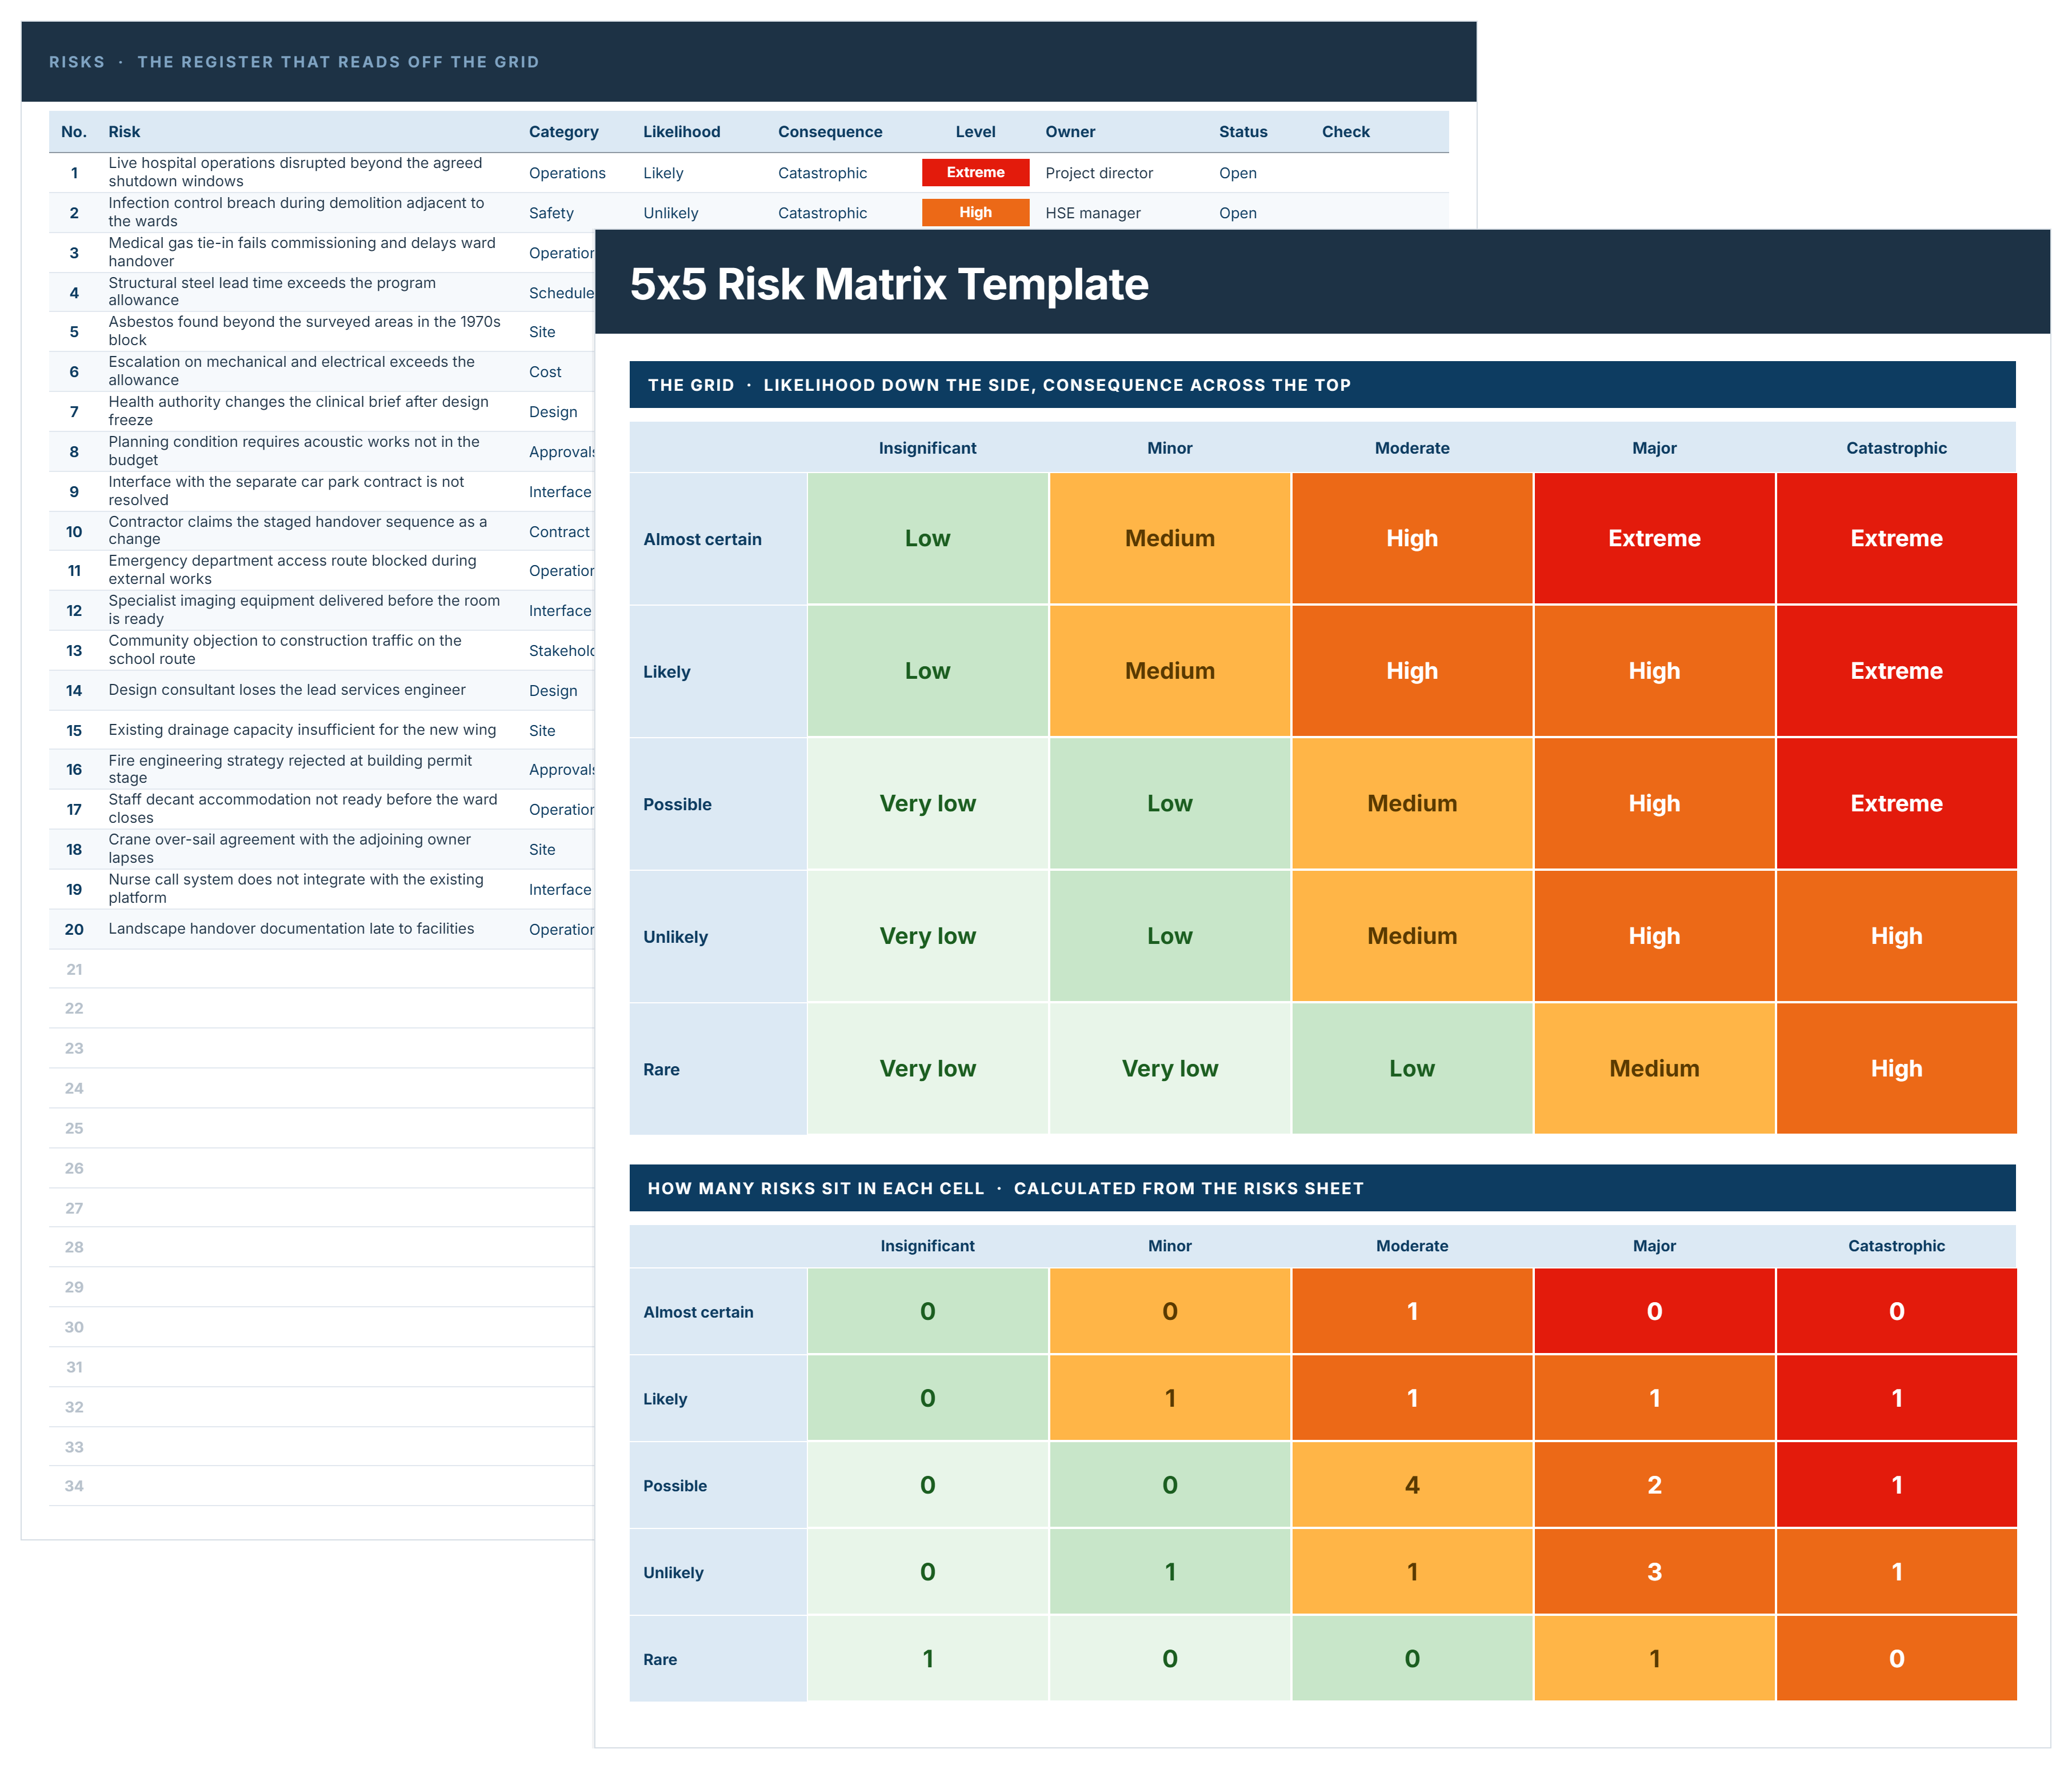
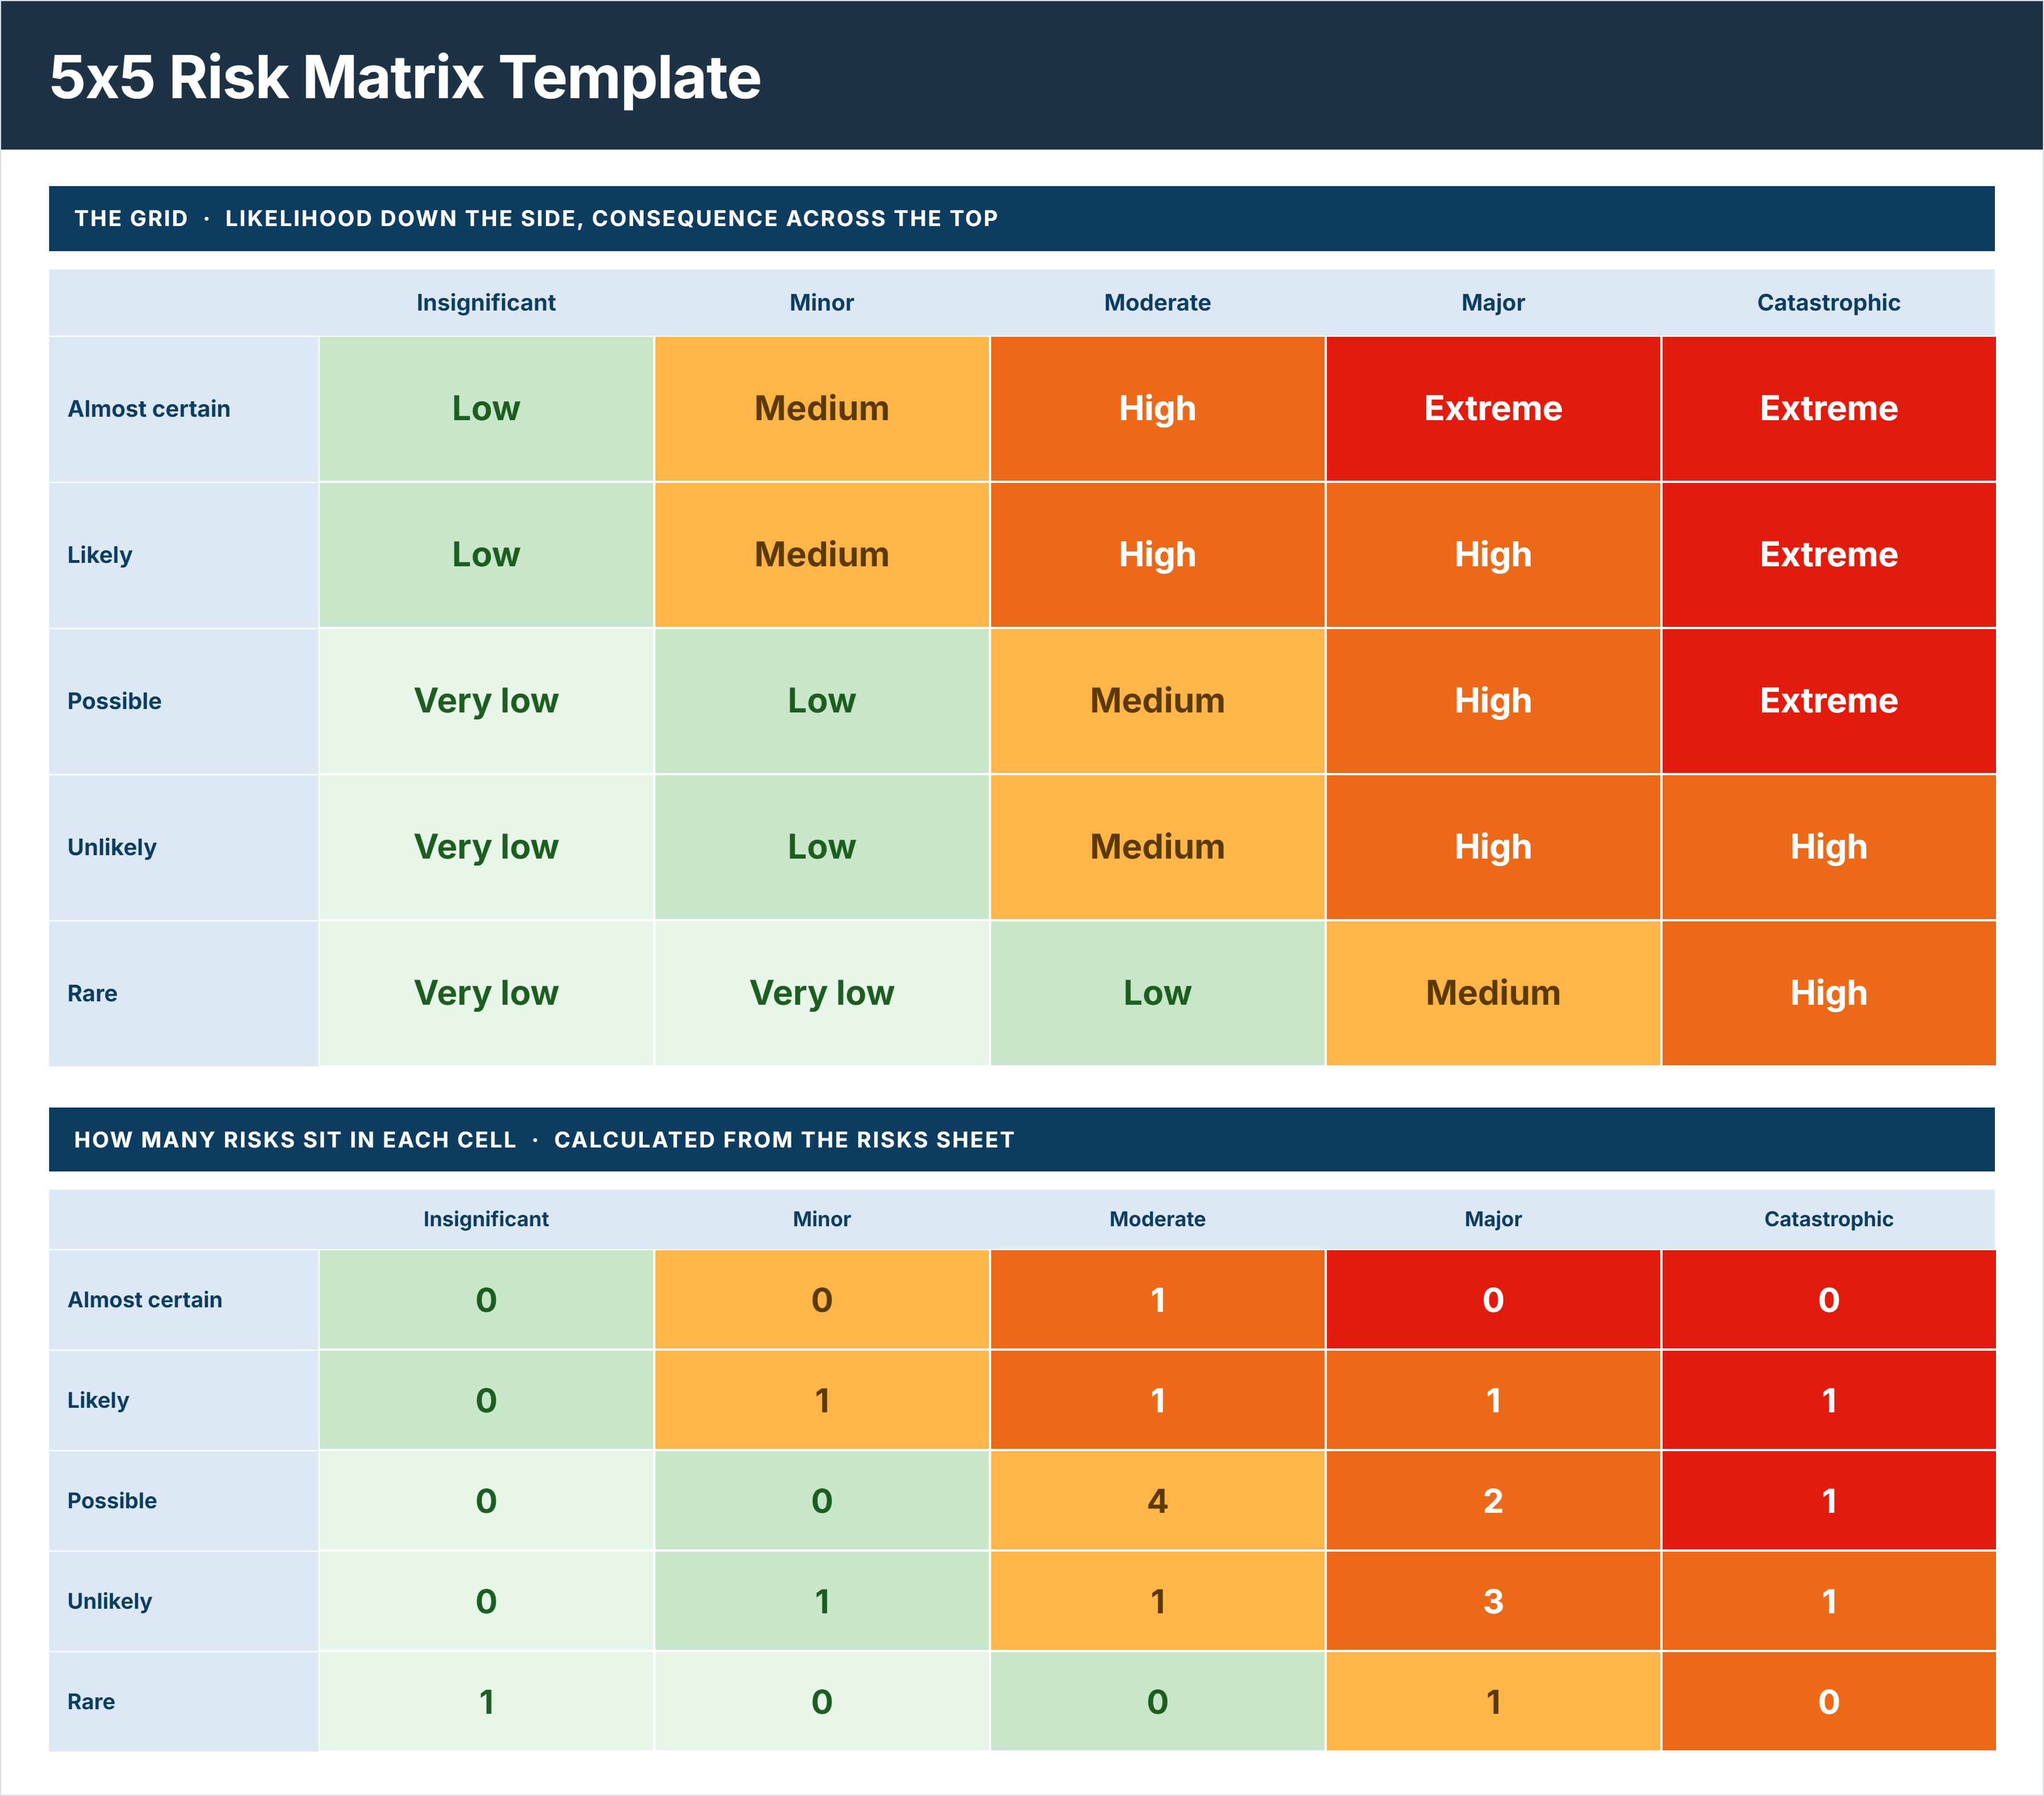
A 5x5 risk matrix is a grid with five likelihood levels down one side and five consequence levels across the top, giving twenty-five cells. Each cell holds a risk level, and a risk scored on both axes takes its level from where the two meet.
Five levels buy you resolution, and they only pay for themselves if the middle three can be told apart. Unlikely, Possible and Likely have to mean different things in writing, and Minor, Moderate and Major likewise. Where they cannot, you have twenty-five cells and a crowd sitting in the centre one.
It is also written as a 5 x 5 risk matrix, a 5 by 5 risk matrix or a 5x5 risk assessment matrix, and the coloured version is sometimes called a risk heat map.
If your team scores by instinct rather than against written scales, a 4x4 risk matrix removes the middle and forces the choice.
What's Included in This 5x5 Risk Matrix Template
Seven sheets, with the grid feeding a register that reads its level straight off it.
The likelihood levels run Rare, Unlikely, Possible, Likely and Almost certain. The consequence levels run Insignificant, Minor, Moderate, Major and Catastrophic. Risk levels are Very low through to Extreme, and every cell is editable, so moving one boundary moves every risk sitting on it.
5x5 Risk Matrix Example
Here's an example of a 5x5 risk matrix, showing the grid and the count of risks sitting in each cell.
How to Use This 5x5 Risk Matrix Template in Excel or Word
Agree the scales before anyone scores anything. On a five-level grid that step matters more, because three of the five levels sit in the middle and they will collapse into each other without written definitions.
- Set the project, assessor, assessment date and next review date on the Cover.
- Pick the scoring convention, untreated or treated, and hold to it across every risk.
- Write the scales in cost, time and safety terms, making sure Unlikely, Possible and Likely are distinguishable on paper.
- Adjust the level in any cell to suit your project, agree the grid once, then leave it alone.
- List each risk on the Risks sheet and score likelihood and consequence from 1 to 5.
- Let the level read off the grid rather than typing it, since a typed level and a scored level will disagree eventually.
- Score the risk as it is today, with the controls actually in place rather than the ones you intend to add.
- Watch the centre cell, since Possible and Moderate is where a risk lands when nobody has looked at it hard enough.
- Where two assessors disagree by a level, resolve it in the room and record which definition each was reading.
- Read the count grid, since a cluster in one cell usually means the scale is too coarse there.
The Summary counts what has settled in the centre and tells you. Treat that number as a measure of your scoring discipline rather than of your risk profile.
Consistency across projects is the harder problem, since twenty-five cells give twenty-five chances to score the same risk differently. Construction risk management software holds the matrix, the categories and the descriptors at system level, so every project scores against the same grid.
Related Articles and Templates
Explore these resources for risk matrices, risk assessment, scoring, and project risk management:
- Risk Assessment Template
- Risk Register Template
- Risk Management Plan Template
- Construction Risk Matrix: Setup, Ratings, & Use Cases
- How to Create a Risk Assessment Matrix for Your Capital Projects
- What is the Probability Impact Matrix?
- Risk Modeling in Construction Project Management: Techniques for Identifying and Mitigating Risks

Written by
Jackson Row
Jackson Row is the Growth & North American Market Lead at Mastt. With a background in risk modeling, cost forecasting, and integrated project delivery, he helps capital project owners work smarter and faster. Jackson’s work supports better tools, better data, and better outcomes across the construction industry.

FREE 5x5 risk matrix template in Excel format. Score likelihood and consequence, and every risk takes its level straight off the grid.

Top Performers Don’t Guess. They Deliver.
Cut the stress of showing up unprepared
Start for FreeTrusted by the bold, the brave, and the brilliant to deliver the future