
What is a PMO Dashboard?
A PMO (Project Management Office) dashboard is a centralized visual interface displaying real-time metrics across multiple projects under PMO oversight. It consolidates project status, budget performance, resource utilization, and schedule adherence into one view.
PMO leaders use this dashboard to answer executive questions instantly without hunting through spreadsheets. The PMO dashboard transforms scattered project data into actionable intelligence for tracking and strategic decision-making.
Traditional PMO reporting involves compiling information from dozens of sources into static presentations. Modern PMO dashboards eliminate that manual work entirely bu automating updates as project managers enter data, keeping executives informed without constant status requests.
What's Included in a PMO Reporting Dashboard?
A PMO reporting dashboard contains essential tracking components that give complete visibility into project performance and organizational delivery capacity. Core PMO dashboard elements track both project-level details and enterprise-wide patterns including:
- Active Project Inventory: Lists all projects with current phase, owner, priority level, and intake volume trends for portfolio visibility.
- Schedule Performance Metrics: Shows on-time delivery percentage, Schedule Performance Index (SPI), delayed projects, and upcoming milestone concentrations across the portfolio.
- Budget vs Actual Spend: Tracks committed costs, Cost Performance Index (CPI), forecasted overruns, and remaining budget across all active projects.
- Resource Utilization Rates: Displays current allocation percentages, overcommitted resources, capacity forecasts, and upcoming constraints by role or team.
- Risk and Issue Counts: Aggregates open risks by severity level with risk velocity trending showing whether portfolio risk is accelerating.
- Project Health Scoring: Uses red-yellow-green indicators based on schedule, budget, scope, and quality performance combined.
- Completed Deliverables: Tracks milestone achievement rates, average project duration, and deliverable approval cycles to measure delivery velocity.
- Change Request Volume: Shows pending changes, approved budget impacts, and change order trends affecting portfolio baseline.
- Stakeholder Engagement Metrics: Monitors communication frequency, decision turnaround times, and outstanding approvals creating bottlenecks.
💡 Pro Tip: Limit your main dashboard to 8-12 key metrics maximum. Information overload kills adoption. Create drill-down views for detailed analysis rather than cramming everything onto one screen.
Why Use a Dashboard for PMO?
A dashboard ensures instant visibility into project performance across your entire organization without manual data compilation. PMO leaders provide accurate status updates within minutes instead of spending days building reports.
Here are the key benefits PMO dashboards deliver over manual reporting:
- Executive Confidence Increases: Board members and C-suite leaders make better portfolio decisions with real-time information rather than outdated estimates.
- Resource Conflicts Resolve Faster: Project managers see capacity constraints before making commitments, preventing overallocation across competing projects.
- Early Warning Systems Catch Problems: Schedule variance trending alerts you to delays before critical paths break completely.
- Standardized Reporting Eliminates Confusion: Every stakeholder interprets red-yellow-green metrics the same way, preventing subjective status disagreements.
- Strategic Alignment Becomes Measurable: Executives quickly identify which strategic initiatives are progressing versus stalled using objective performance data.
- Governance Overhead Decreases: Executives check dashboards independently rather than requesting custom reports, freeing PMO teams to solve problems.
- PMO Credibility Grows Stronger: Answering unexpected questions immediately during meetings prevents the "I'll get back to you" response undermining authority.
- Budget Forecasting Improves Accuracy: Finance teams predict cash flow requirements using actual spend patterns rather than baseline projections.
Real-time data access fundamentally changes how organizations view their PMO. Instead of being seen as administrative overhead, your PMO becomes strategic infrastructure. Executives rely on your dashboards for portfolio decisions affecting millions in capital deployment.
How to Set Up and Use PMO Dashboards
Build effective PMO dashboards by defining your key metrics first, then designing layouts that display those metrics clearly for decision-makers. Here's the step-by-step process for building and using PMO dashboards:
- Interview Stakeholders About Their Questions: Ask executives what they need to know during meetings to identify which metrics your dashboard must display.
- Define Health Scoring Thresholds: Set specific criteria for red-yellow-green indicators, such as red meaning 10% budget variance or two-week schedule delays.
- Select Your Core KPIs: Choose 8-12 metrics like on-time percentage, budget variance, resource utilization, and project intake volume.
- Design the Visual Layout: Place critical information in the top-left quadrant and group related metrics together logically.
- Connect Your Data Sources: Link project management systems to your dashboard tool for automated updates.
- Add Drill-Down Views: Configure summary tiles to reveal detailed information when users click them.
- Test With Real Users: Show draft dashboards to executives and project managers, then iterate based on their feedback.
- Review Daily for Risk Signals: Check your dashboard each morning for negative trends requiring immediate attention.
- Filter During Meetings: Adjust views to show only relevant portfolio segments for focused discussions.
💡 Pro Tip: Build a "portfolio pulse" tile showing one number like percentage of projects meeting all success criteria. Executives value single metrics over complex displays when answering "How's the portfolio doing?"
Get the Best-Fit PMO Dashboard with AI Template Studio
Finding the right PMO dashboard structure shouldn't mean building from scratch or copying outdated formats. Mastt's AI Template Studio instantly connects you with professional dashboard templates designed for portfolio oversight and PMO reporting.
Here's what AI Template Studio delivers for PMO leaders seeking dashboard solutions:
🚀 Search pre-built dashboard templates: Explore dozens of PMO-ready templates designed for portfolio tracking, executive reporting, and multi-project oversight.
🎯 Match templates to your portfolio: From small PMOs managing 10 projects to enterprise portfolios with 100+ initiatives, AI recommends structures aligned with your governance model.
⚡ Start with a complete framework: Generate dashboards with sections for portfolio health scoring, resource utilization, budget variance, schedule performance, and strategic alignment ready for immediate use.
📊 Get presentation guidance: Ask AI for tips on communicating portfolio status to boards or structuring dashboard views for different executive stakeholders.
Instead of spending weeks designing portfolio views or debating metrics, you can have a fully structured PMO dashboard operational in minutes.
Here's how to use AI Template Studio:
- Access AI Template Studio: From your Mastt workspace, click Start a Dashboard and select AI Assisted to open the template search tool.
- Describe your needs: Type what you're looking for in the search box, such as "PMO dashboard" or "portfolio reporting dashboard". AI instantly returns the three most relevant templates.
- Preview and select: Review recommended options with descriptions. Click Preview to see the full dashboard layout and verify it matches your PMO requirements.
- Customize and launch: Click Use This Template and Mastt generates the complete structure. Populate it with your portfolio data and adjust sections as your governance priorities evolve.
All dashboards include enterprise-grade security protecting sensitive portfolio and financial data. Your project information remains completely private and confidential throughout the creation process.
💡 Pro Tip: Be specific in your search queries. "Executive PMO dashboard for board reporting" returns more targeted results than just "dashboard." You can refine searches multiple times until finding your ideal match.
👉 Learn more about dashboard creation in the Mastt Help Center.
Who Should Use a PMO Dashboard Template?
PMO dashboard templates are designed for project management professionals who oversee multiple projects simultaneously and report portfolio performance to executives. These dashboards serve leaders responsible for organizational project delivery rather than single-project teams.
Here are the PMO and portfolio management professionals who gain the most value from dashboards:
✅ PMO Directors: Demonstrate PMO value to leadership through delivery metrics and portfolio performance trends.
✅ Portfolio Managers: Monitor capital programs, make prioritization decisions, and forecast portfolio completion timelines for executive committees.
✅ Program Managers: Track interdependent project clusters and report program-level budget and schedule performance to steering committees.
✅ VP of Construction/Capital Projects: Present portfolio status to boards and allocate project funding strategically across competing priorities.
✅ Chief Operations Officers: Oversee enterprise project portfolios and make capital deployment decisions affecting strategic objectives.
✅ Directors of Project Controls: Establish performance baselines across portfolios and track earned value metrics following PMI standards.
✅ Infrastructure Portfolio Managers: Manage public sector programs, report to elected officials, and coordinate long-term capital planning initiatives.
✅ Real Estate Development Directors: Oversee development pipelines and prepare investment committee presentations with consistent portfolio metrics.
💡 Pro Tip: Tailor dashboard views by role rather than creating separate dashboards. PMO directors need portfolio KPIs while project controls teams need variance analysis. One template with role-based filters serves everyone.
When to Use a Project Management Office Dashboard
Deploy a project management office dashboard when your PMO manages enough concurrent projects that manual status compilation becomes inefficient or unreliable. Most organizations hit this threshold around 10-15 active projects where spreadsheet tracking breaks down.
Here are the key situations when PMO dashboards become essential for portfolio management:
- Establishing a New PMO: Launch with dashboards from day one to demonstrate value immediately through clear delivery visibility and standardized reporting.
- Portfolio Expansion Phases: Implement before growing from 15 to 40+ projects when manual tracking systems become overwhelmed by volume.
- Executive Reporting Changes: Deploy when leadership demands faster, more frequent status updates beyond monthly PowerPoint presentations.
- Resource Conflict Escalations: Use when competing project priorities create allocation disputes requiring visible, objective capacity data.
- Post-Failure Recovery: Implement following significant project failures or budget overruns to rebuild stakeholder confidence through improved controls.
- Organizational Restructures: Launch during transitions affecting project ownership when consistent visibility maintains accountability despite reporting line changes.
- Leadership Transitions: Deploy when new executives need rapid portfolio understanding without lengthy briefings or presentations.
- PMO Maturity Advancement: Use when pursuing higher maturity levels requiring standardized metrics and governance demonstration for assessments.
- Fiscal Year Starts: Align dashboard launches with annual planning cycles when stakeholders focus on forward-looking performance metrics.
Organizations waiting until manual reporting completely breaks down spend months rebuilding credibility. Early dashboard adoption prevents governance gaps from developing.
💡 Pro Tip: Time dashboard launches with fiscal year starts or major planning cycles. Stakeholders are already focused on performance metrics, making adoption smoother than mid-cycle implementations that interrupt established routines.
Common Problems with Manual PMO Reporting
Manual PMO reporting creates significant inefficiencies and accuracy problems that undermine portfolio management effectiveness and executive confidence. PMO teams struggle with data consolidation, version control, and maintaining current information across growing project portfolios.
Here are the critical problems PMO leaders face with manual reporting and basic dashboard tools:
⚠️ Compilation Time Drains Resources: PMO teams spend 10-15 hours weekly gathering project data from different systems and reformatting for consistent presentations.
⚠️ Stale Data Misleads Decisions: Reports reflect information that's 2-4 weeks old by presentation time, causing executives to make decisions on outdated portfolio status.
⚠️ Version Control Creates Confusion: Multiple Excel versions circulating among stakeholders lead to conflicting interpretations and incorrect portfolio assessments.
⚠️ Inconsistent Metrics Across Projects: Each project manager defines "at risk" differently, making portfolio-level health comparisons meaningless for executive decision-making.
⚠️ Formula Errors Destroy Credibility: Budget calculations breaking when projects get added produce embarrassing corrections after board presentations.
⚠️ No Drill-Down Capability: Executives asking follow-up questions during meetings can't get immediate answers because supporting detail doesn't exist in summary slides.
⚠️ Resource Visibility Gaps: Allocation conflicts discovered only when resources miss commitments because no centralized view shows overallocation patterns.
⚠️ Reactive Problem Detection: Issues surface in status reports after they've escalated rather than through predictive trending that enables early intervention.
⚠️ Update Burden Causes Delays: Complex reporting templates discourage project managers from providing updates, creating information blackouts before critical executive meetings.
⚠️ Lost Historical Context: Past performance patterns remain invisible because historical data lives in archived PowerPoint files rather than queryable systems.
💡 Pro Tip: Calculate your team's actual hours spent on manual reporting monthly. Present this number when proposing modern dashboard investments. "Getting 160 hours back monthly" resonates with executives more than "improving efficiency."
Transform PMO Reporting and Portfolio Oversight with Mastt
Your PMO shouldn't spend half its time explaining what's happening instead of making it happen. Mastt eliminates the reporting burden through real-time dashboards that answer executive questions instantly.
No more weekend PowerPoint marathons before board meetings. No more hunting through emails for project status. Your team gets 160+ hours back monthly to focus on improving delivery while executives gain the confidence that comes from seeing portfolio performance anytime they need it.
👉 Start building professional PMO dashboards with Mastt AI Template Studio today.

Written by
Jackson Row
Jackson Row is the Growth & North American Market Lead at Mastt. With a background in risk modeling, cost forecasting, and integrated project delivery, he helps capital project owners work smarter and faster. Jackson’s work supports better tools, better data, and better outcomes across the construction industry.

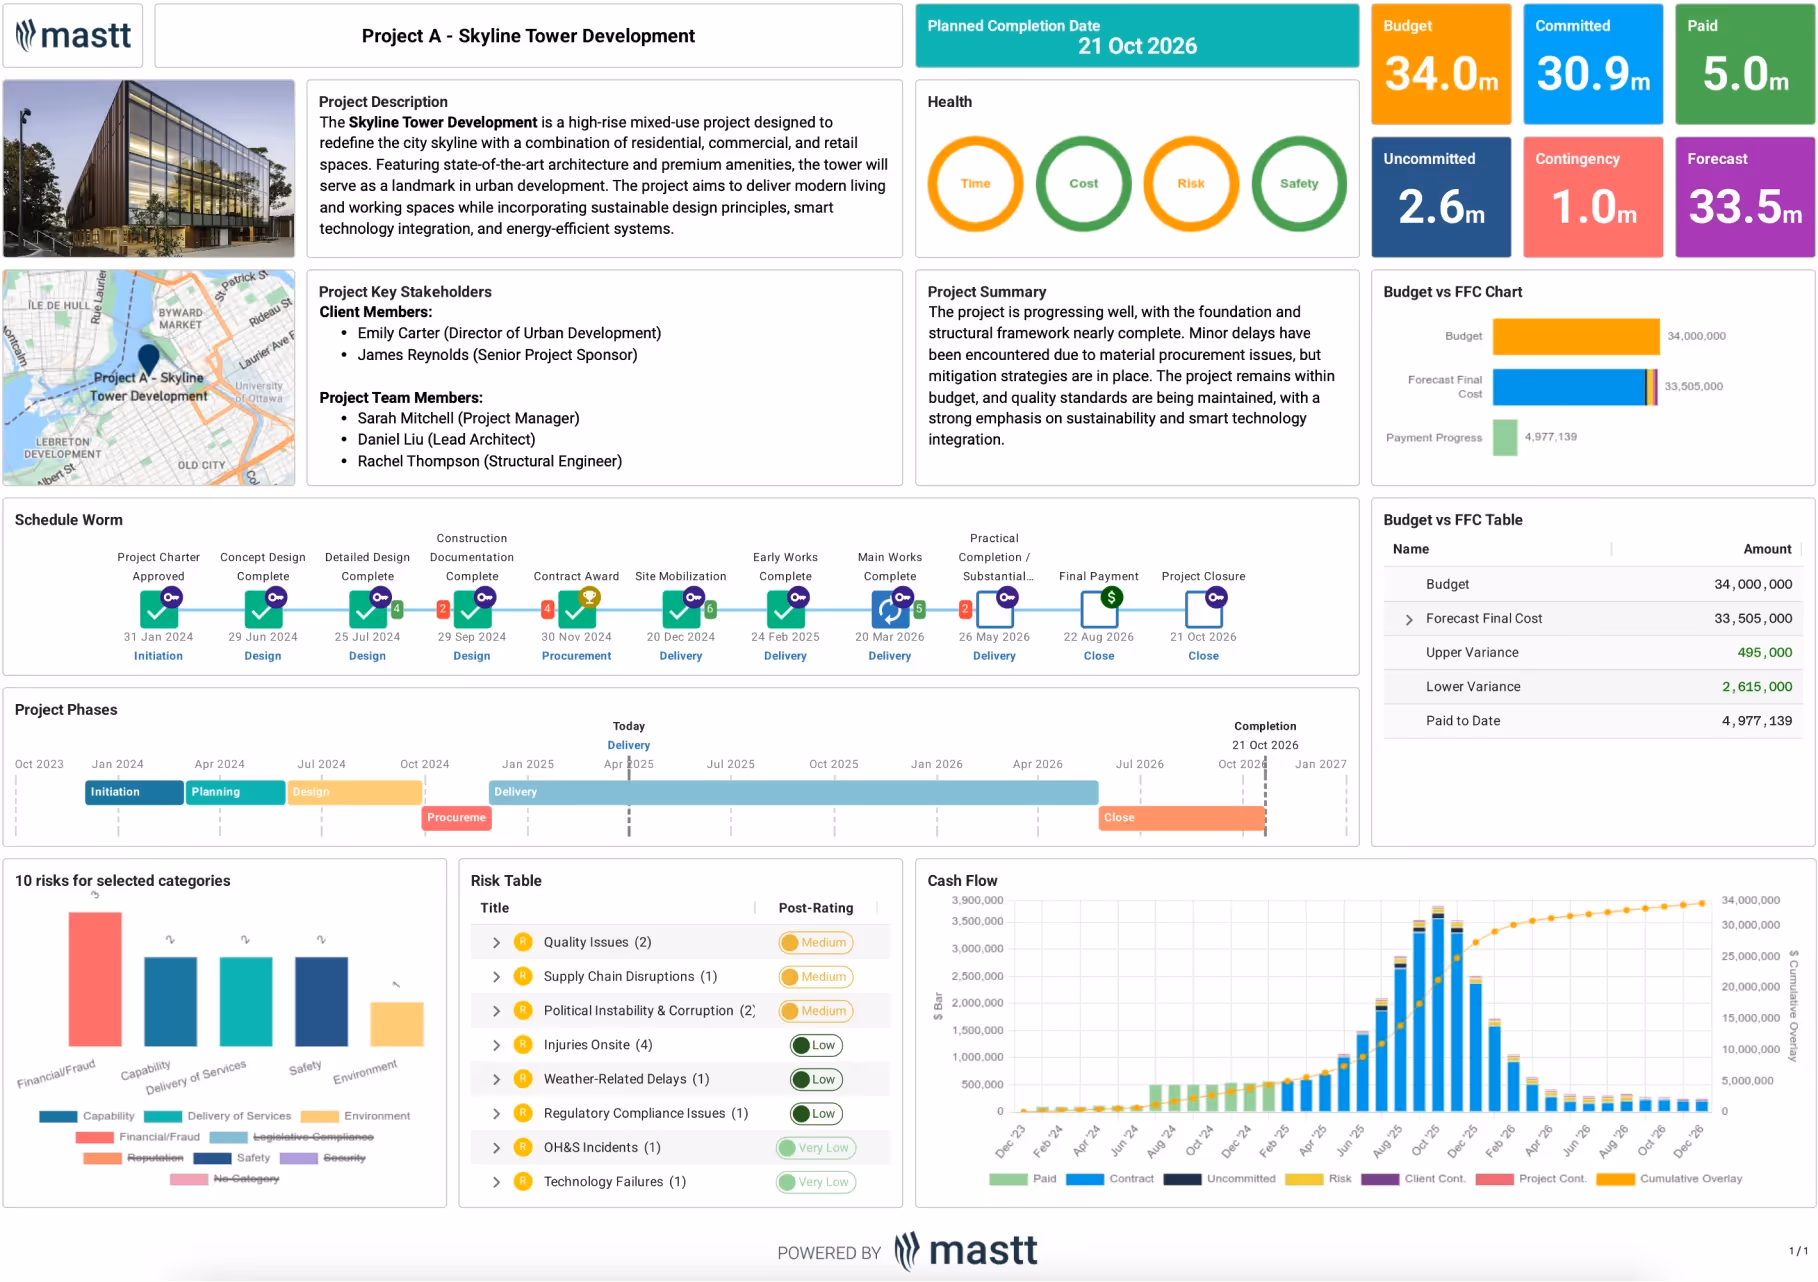
Use this FREE PMO Dashboard to track portfolio performance, project health, and resource allocation in one view. Answer executive questions instantly and stop spending days compiling manual status reports.

Top Performers Don’t Guess. They Deliver.
Cut the stress of showing up unprepared
Start for FreeTrusted by the bold, the brave, and the brilliant to deliver the future