
What is a Project Controls Dashboard?
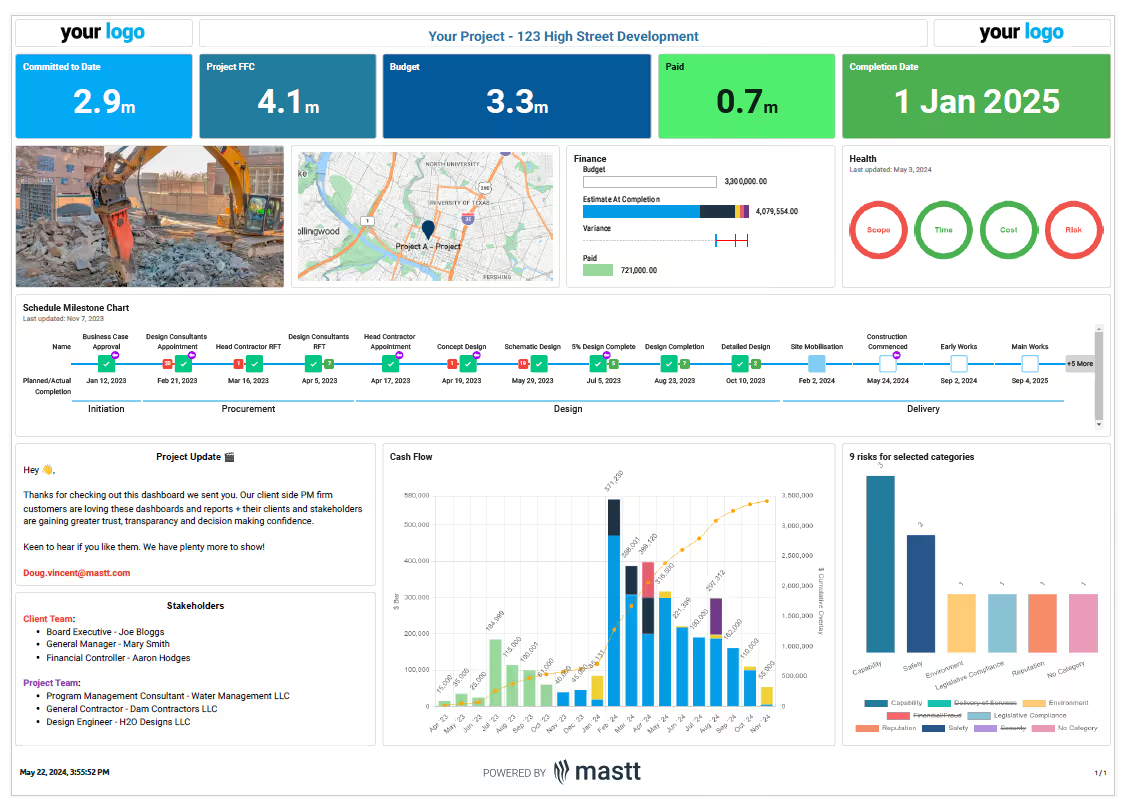
A Project Controls Dashboard is a reporting tool that unifies the core functions of project controls into one connected view. It organizes budgets, schedules, risks, and performance indicators into visual formats that make reporting easier to interpret.
The dashboard uses project control charts and status indicators to show variances, trends, and forecasts. This gives teams an instant understanding of how the project is performing against baselines and where corrective action may be required.
What’s Included in a Project Controls Dashboard?
A project controls dashboard includes the essential data and visual tools needed to manage cost, schedule, risk, and performance in one view. It combines financial tracking, scheduling updates, and risk oversight with project control charts that highlight progress against baselines.
Typical components of a project control dashboard include:
- Schedule & Timeline Oversight: Monitors progress against the baseline schedule, highlights critical path risks, and tracks milestones to keep delivery on time.
- Cost & Budget: Compares budget to actuals, uses earned value metrics like CPI, and includes forecasting tools to manage construction cash flow and future costs.
- Risk & Issue: Maintains a live risk register, monitors probability and impact, and tracks mitigation, change requests, and contingency use.
- Quality & Safety Metrics: Records safety incidents, compliance results, and inspection outcomes while monitoring quality checkpoints and rework rates.
- Resource Performance: Tracks labor productivity, equipment utilization, and subcontractor performance to optimize resource allocation.
- KPIs & Visuals: Displays indices such as cost and schedule performance indices (SPI and CPI), project health scores, and forecasts using charts, trend lines, and traffic-light indicators.
Use project control charts to link cost, schedule, and risk data. When these metrics are viewed together, trends and variances become clearer, giving teams the insight needed to act before issues escalate.
Why Use a Dashboard for Project Controls?
A dashboard for project controls is critical for maintaining oversight across complex construction projects. It transforms raw cost, schedule, and risk data into a single, reliable view, ensuring decisions are based on facts rather than fragmented reports.
Key reasons to use a dashboard for project controls include:
- Strategic visibility: Project control charts translate complex data into insights that reveal trends, risks, and performance gaps.
- Better governance: Owners gain access to transparent financial reporting, which supports informed approvals and funding decisions.
- Early intervention: Real-time metrics highlight issues before they escalate, enabling corrective action at the right time.
- Portfolio consistency: Standardized dashboards allow leaders to compare performance across multiple projects with confidence.
💡 Pro Tip: Automate project controls reporting where possible. Dashboards that update in real time reduce manual effort and give decision-makers confidence that they are working with the most accurate data.
How to Use a Project Controls Dashboard
To use a project controls dashboard effectively, set it up with accurate baseline data, define responsibilities for updates, and make it part of the project controls workflow. The dashboard should be maintained as a live tool, not just a reporting output.
- Define project controls scope: Decide which areas to track, such as budgets, earned value metrics, forecasts, schedules, and risk registers, and structure the dashboard to display them clearly.
- Establish baselines: Enter approved budgets, planned schedules, and baseline risk assessments. These provide the benchmarks for measuring variance and performance.
- Assign data owners: Allocate responsibility to project controls staff, commercial managers, or schedulers to keep cost, schedule, and risk data accurate.
- Maintain regular updates: Link the dashboard to live data sources where possible or refresh at set intervals to ensure project controls reporting reflects current conditions.
- Drill into variances: Use project control charts to investigate cost or schedule deviations, analyze drivers of variance, and adjust forecasts accordingly.
- Evolve with the project: Add new KPIs or controls categories as scope changes, risks emerge, or reporting needs expand.
When embedded into the project controls process, the dashboard becomes more than a reporting tool. It’s an active management system that supports governance, forecasting, and informed decision-making.
Get the Best-Fit Project Controls Dashboard with Mastt AI
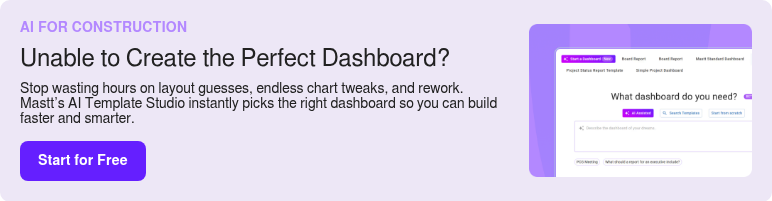
Managing project controls across scattered spreadsheets and disconnected reports often creates delays, version issues, and blind spots. Mastt's AI Template Studio helps project teams skip manual formatting and instantly generate the right project controls dashboard for their needs.
With AI Template Studio, you can:
🚀 Explore ready-made controls dashboards: Choose from best-practice dashboards built for cost tracking, schedule monitoring, risk reporting, and project control charts.
🎯 Match the dashboard to your workflow: Whether you manage a single project, a capital program, or a full portfolio, AI recommends structures that fit your project controls reporting needs.
⚡ Start with a complete framework: Instantly launch a dashboard with live budget, schedule, risk, and KPI data linked and ready to customize.
If you don’t want to build from scratch, AI Template Studio can create a Project Controls Dashboard in just a few clicks.
Here’s how to get started with AI Template Studio:
- Open AI Template Studio: From your Mastt dashboard, select Start a Dashboard and choose AI Assisted.
- Describe your needs: Type “Project Controls Dashboard” in the search bar, and AI will return the most relevant dashboard options.
- Preview and select: Review the recommended layouts, click Preview, and pick the one that best fits your reporting needs.
- Customize and launch: Click Use This Template, populate it with your project data, and adjust sections as the project evolves.
For more tips, visit the Mastt's help page to get the most out of AI Template Studio.
Who Should Use a Project Controls Dashboard?
A project controls dashboard is helpful for anyone responsible for overseeing the financial, schedule, and risk performance of a construction project. It serves as a central tool for project teams who rely on accurate, connected data to make informed decisions.
The dashboard for project controls is most valuable for:
✅ Project Owners and Project Managers: Gain transparency over budgets, risks, and delivery progress to support funding approvals and investor reporting.
✅ Client-Side Project Managers and Construction Managers: Track schedules, manage risks, and ensure projects remain on time and within budget.
✅ Project Controls Engineers: Monitor earned value metrics, analyze variances, and prepare accurate forecasts with confidence.
✅ Commercial and Contract Administration Teams: Manage change orders, contracts, and payment claims with data linked directly to cost and performance reporting.
✅ Program Managers and Portfolio Managers: Compare performance across multiple projects using standardized dashboards for consistent reporting.
✅ Delivery Teams and Consultants: Stay aligned with live updates on progress, risks, and performance indicators, reducing reliance on fragmented reports.
💡 Pro Tip: A Project Controls Dashboard delivers the most value when used collaboratively. Involving owners, managers, commercial staff, and delivery teams ensures everyone works from the same live data, improving alignment and governance.
When to Use a Project Controls Dashboard?
A project controls dashboard is most valuable when tracking performance against baselines and making time-critical decisions. It ensures that cost, schedule, and risk data are accurate, connected, and ready for reporting.
You’ll get the strongest impact from a project controls dashboard during:
- Baseline reviews: Validate approved budgets, schedules, and risk registers before project execution begins.
- Stage gate approvals: Present stakeholders with live cost, schedule, and risk data to support go/no-go decisions.
- Variance analysis: Monitor cost and schedule deviations in real time using earned value metrics and project control charts.
- Forecasting cycles: Update EAC and other forward-looking metrics to support proactive planning.
- Change management: Assess the financial and scheduling impacts of change orders, scope shifts, or contract amendments.
- Governance checkpoints: Provide stakeholders with live data during stage gates, funding approvals, and audit reviews.
- Program and portfolio reporting: Standardize project controls reporting to compare performance consistently across multiple projects.
- Risk escalation meetings: Monitor mitigation progress and assess the impact of emerging risks on cost and schedule.
💡 Pro Tip: Use the dashboard not only at major milestones but also as part of regular project meetings. Consistent use makes project controls proactive rather than reactive.
Common Problems with Manual Dashboards
Manual dashboards lack the structure and accuracy required for effective project controls. Instead of providing reliable oversight, they often create blind spots and delays in reporting.
❌ Disconnected baselines: Budgets, schedules, and risk registers are managed separately, making it hard to measure performance against an agreed baseline.
❌ Stale earned value data: Manual updates mean cost and schedule performance indices are outdated by the time reports are distributed.
❌ Limited forecasting: Spreadsheets rarely link actuals to EAC or cash flow forecasts, weakening forward-looking controls.
❌ No audit trail: Changes to cost, schedule, or risk data aren’t tracked, reducing accountability and compliance.
❌ Inconsistent governance: Without standardized project control charts, cross-project reporting becomes unreliable and difficult to compare.
Upgrade to a Better Project Controls Dashboard with Mastt
Manual project controls in spreadsheets slow down decisions and weaken governance. With Mastt, budgets, schedules, risks, and performance indicators are connected in one system. Project control charts update automatically, forecasts remain accurate, and stakeholders share a single reliable source of truth.
By standardizing reporting across projects, Mastt strengthens oversight and enables faster, evidence-based decision-making. Instead of chasing data, project teams can focus on delivering outcomes with confidence.
⚡ Create your project controls dashboard in minutes with Mastt’s AI Template Studio. Enter your requirements, select a tailored layout, and begin tracking with clarity from day one.

Written by
Jackson Row
Jackson Row is the Growth & North American Market Lead at Mastt. With a background in risk modeling, cost forecasting, and integrated project delivery, he helps capital project owners work smarter and faster. Jackson’s work supports better tools, better data, and better outcomes across the construction industry.

Use this FREE Project Controls Dashboard to oversee cost, schedule, risks, and performance with precision. Track key metrics in one connected view, supported by live project control charts and real-time reporting.

Top Performers Don’t Guess. They Deliver.
Cut the stress of showing up unprepared
Start for FreeTrusted by the bold, the brave, and the brilliant to deliver the future