


.avif)

Project portfolio reporting helps capital project owners explain how approved investment is translating into delivery. A board report should make emerging problems and required decisions easy to identify. This article explains how to structure that report, select useful metrics, and turn project updates into recommendations.
What Is Project Portfolio Reporting?
Project portfolio reporting is the process of collecting and presenting information about a group of projects in a consolidated report. It describes the portfolio’s current status, financial position, delivery progress, and forecast outcomes for a defined reporting period.
For a capital project portfolio, this information typically includes approved budgets, forecast final costs, milestone dates, and significant risks across construction and infrastructure projects. The report combines portfolio totals with individual project results.
In my experience, a portfolio report earns its place once you are running several projects at once and the people reading it are not hands-on. They need to see quickly what the finances, the program, and the risk are doing across the whole portfolio.

What Should a Capital Project Portfolio Report Include?
A capital project portfolio report should explain the investment position, delivery outlook, and matters requiring board attention. Give readers a concise overview, followed by exceptions and supporting detail.
Use the following structure as a starting point, adapting it to your board's responsibilities and reporting requirements.
- Executive summary: State the overall position, significant changes since the previous report, and decisions requested.
- Financial outlook: Show approved budgets, forecast final costs, expenditure, commitments, and expected cash requirements.
- Delivery outlook: Compare approved milestones with forecast dates and explain consequences for asset use or service delivery.
- Risks and dependencies: Identify significant exposure, shared constraints, and the actions underway to address them.
- Decision requests: Set out recommendations, alternatives, financial implications, and the date each decision is needed.
- Supporting detail: Include the project register, detailed forecasts, and relevant records in appendices or linked reports.
Add the reporting cutoff date, portfolio scope, and accountable report owner, so readers know which projects and period the figures cover.
Keep significant safety, quality, and compliance issues visible when they affect oversight or require escalation. Include the affected projects and management response.
💡 Pro tip: Report status against the outcome each project was meant to deliver. That way, an on-budget project that's running late still shows as risk.
Which Portfolio Metrics Should You Report to the Board?
Choose metrics that help the board assess affordability, delivery confidence, and exposure. Show the comparison point and explain what has changed since the previous report. The following measures provide a practical starting set for capital-project reporting.
Boards most often see two of these metrics misreported. Here is how to get each right:
Separate spending from forecast final cost
Spending below budget does not mean a project will finish within budget. Much of the work may be unpaid or uncontracted. Report forecast final cost to show the expected total:
Forecast final cost = actual costs to date + estimated cost of remaining work.
Define commitments consistently, since a commitment that already includes invoiced work double-counts if you also add it to actual costs. Mastt's cost reporting guide covers the project-level inputs. Forecasts should update as delivery information improves.
Show status alongside its cause and trend
Set agreed RAG (Red, Amber, Green) thresholds for each dimension and show the status as a text label, not color alone. Keep cost and schedule status separate when they tell different stories.
Show the previous period beside the current status so movement is visible, and never average colors into one reassuring portfolio label. Pair any overall status with the exceptions behind it. A RAG status template gives a consistent starting structure.
How to Create a Project Portfolio Report
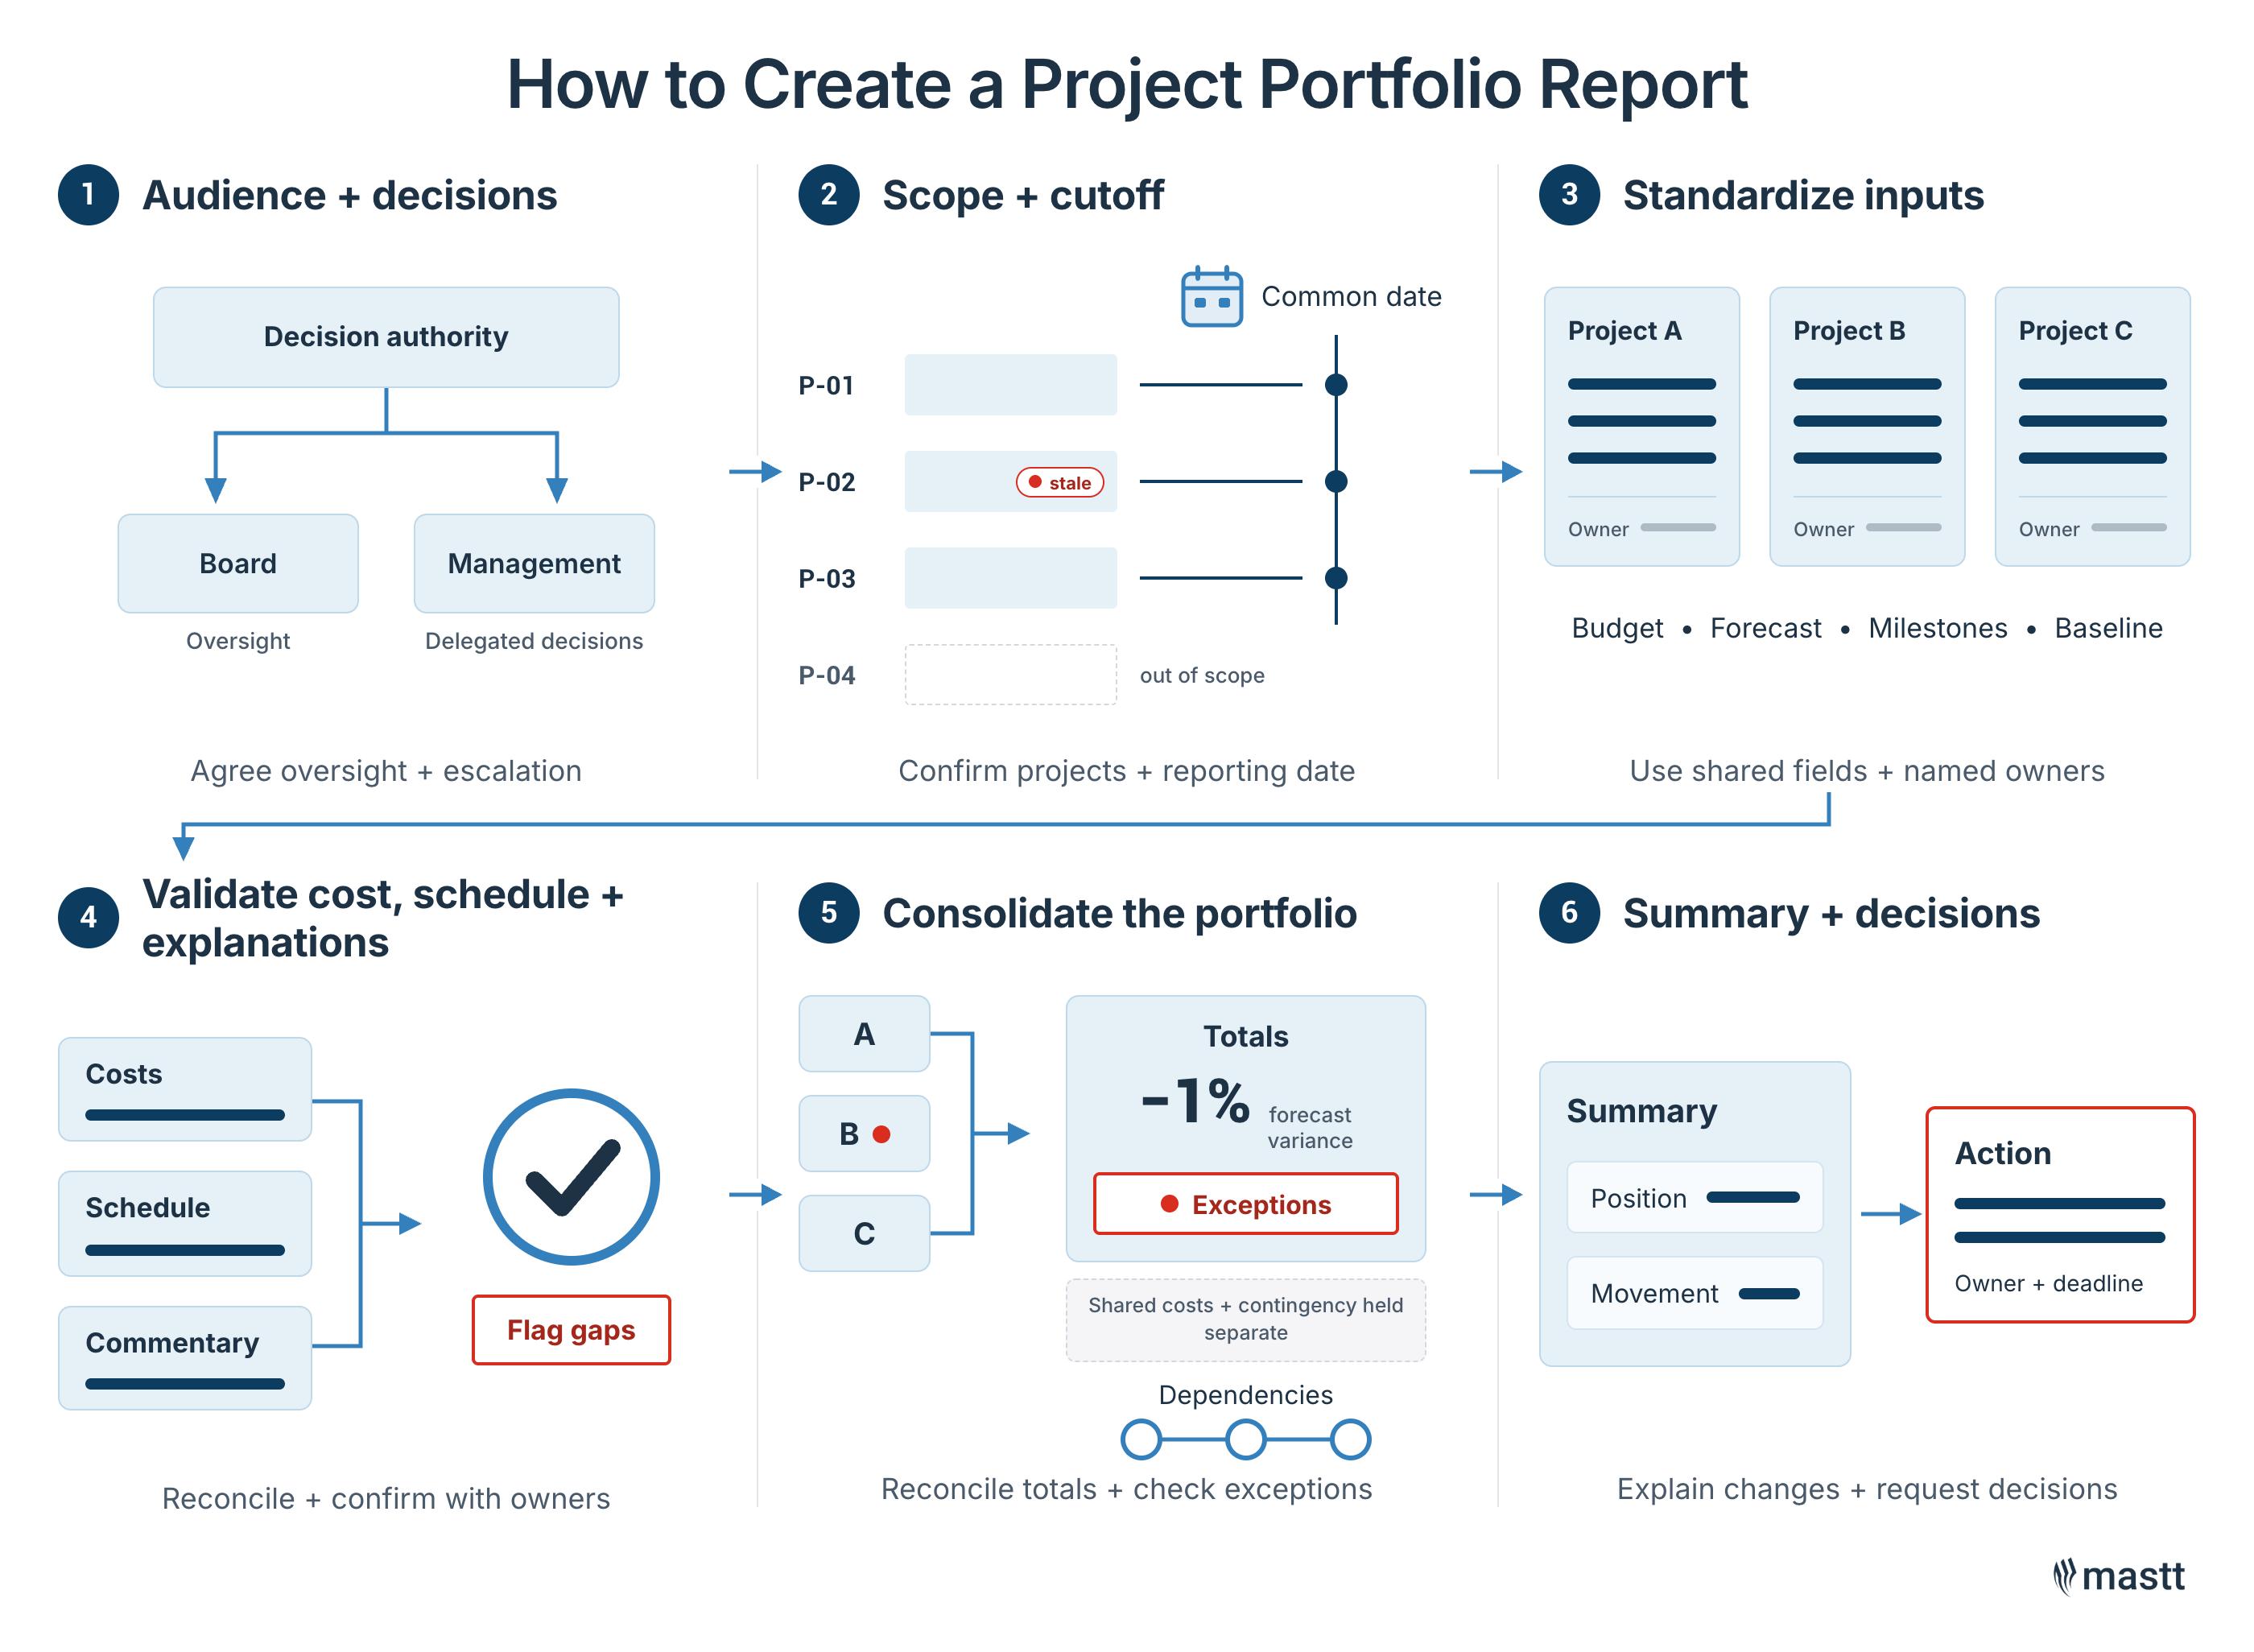
Create the report by agreeing on its scope, standardizing project inputs, and validating the resulting portfolio view. Then explain the significant movements and prepare the decisions that follow.
Step 1: Define the audience and decisions
Confirm what the board oversees and which decisions remain delegated to management. Use that distinction to determine the report's detail and escalation criteria.
For each proposed section, identify the question it answers. A funding discussion needs forecasts and cash requirements. A project delivery discussion needs milestones and dependencies.
I start by setting the framework to match the governance it sits under, whether that is government, business, or project governance. Work through the reporting tempo, the stakeholder level, and the core areas that genuinely need reporting before you choose any tool.
Step 2: Set the portfolio scope and reporting cutoff
List the projects included and assign each a unique identifier. Distinguish active projects from proposed, paused, and completed work.
Set a common cutoff date and flag any older inputs. If project membership changes, explain how additions or removals affect comparisons with the previous report.
Step 3: Standardize project inputs
Give project teams a shared reporting structure with defined fields and named owners. Specify the approved budget, current forecast, milestone dates, status rationale, and decisions needed.
Record financial values on a consistent basis, including currency and treatment of contingency. Separate approved budget changes from forecast movements.
Preserve the original baseline where required, alongside the current approved baseline. A revised budget should remain traceable to its approval.
Step 4: Validate costs, schedules, and explanations
Reconcile actual costs with finance and commitments with the relevant contract records. Check that forecasts cover the remaining scope and explain significant changes.
Challenge schedule updates against delivery evidence. A revised date should reflect the work and dependencies needed to reach that milestone.
Check whether delays change the cost forecast.
Ask project owners to confirm their inputs. Flag missing or stale information explicitly so uncertainty remains visible in the report.
Step 5: Consolidate the portfolio view
Add comparable financial values and reconcile the totals to project records. Keep shared costs and central contingency separate where allocating them would create duplication.
Calculate the portfolio percentage using totals. An unweighted average of project percentages can misrepresent the financial position.
Forecast variance (%) = [(total forecast final cost − total approved budget) ÷ total approved budget] × 100.
The example below has a forecast variance of -1%, indicating forecast headroom of 1% against the approved budget.
Check the exceptions behind the totals, since a favorable net position can conceal a significant overrun in a single project.
Identify shared suppliers, specialist resources, and delivery dependencies. Explain which projects compete for the same capacity and when that competition affects delivery.
Step 6: Write the executive summary and decision requests
Write the summary after validating the report. Explain the current position, its movement since the previous period, and the action required.
For each exception, state what happened and its consequence. Follow with management's response, the accountable owner, and any decision deadline.
Replace vague commentary such as "costs are being monitored" with a specific explanation. Identify the affected package, forecast movement, and proposed action.
Project Portfolio Reporting Example for Capital Projects
The hypothetical example below shows how portfolio totals and project exceptions can lead to different conclusions. All amounts are in millions of US dollars.
The approved budgets include project contingency. Forecasts include remaining-work allowances; no separate central contingency exists in this example.
Forecast variance equals forecast final cost minus approved budget. Positive values indicate forecast overruns; negative values indicate forecast headroom.
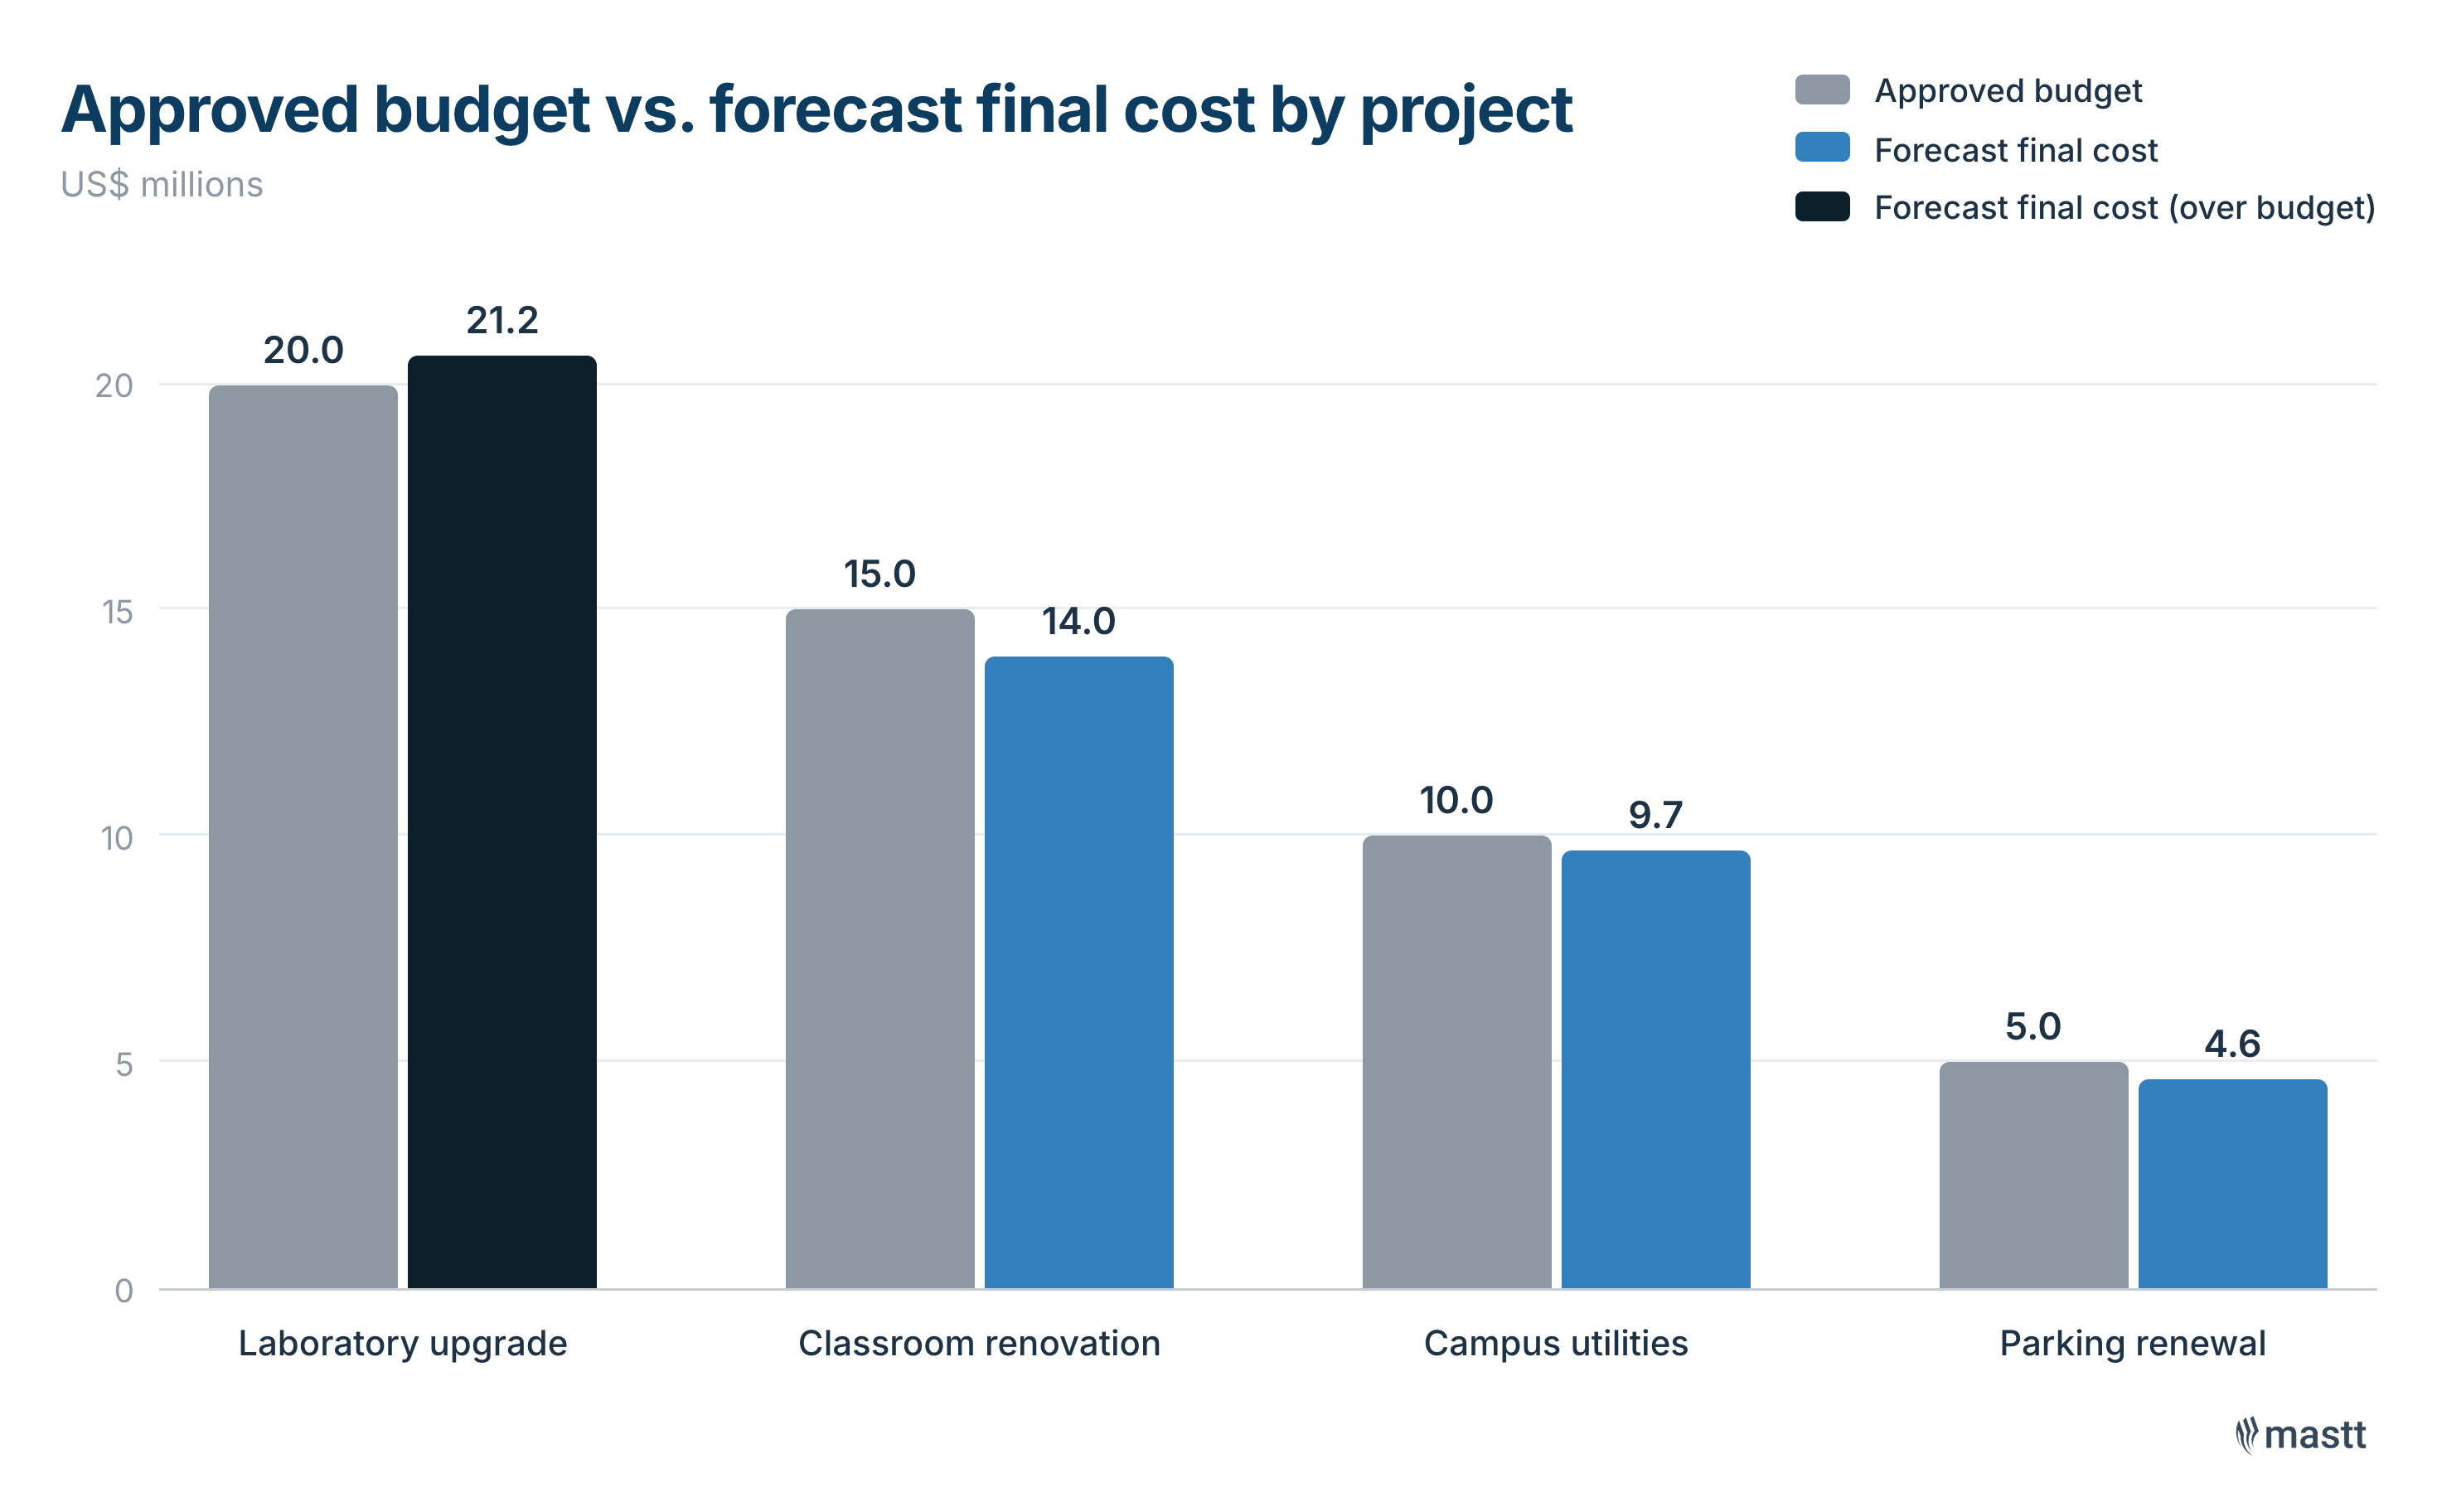
The portfolio forecasts $0.5 million below its $50 million approved budget. The laboratory forecasts a $1.2 million overrun and a six-week delay. Teaching sessions planned for the upgraded space would start six weeks later.
The previous portfolio forecast was $48.7 million. The new forecast represents a $0.8 million deterioration, entirely attributable to the laboratory's remaining mechanical and commissioning work.
The other projects' combined $1.7 million headroom remains forecast, rather than realized savings. Their remaining scope and risks still need review before funds can be released.
Explain what the board needs to decide
For this example, assume one unrestricted funding source supports all projects and the board can approve transfers between them.
The board is being asked to decide the following:
- Recommendation: Transfer $1.2 million to the laboratory, funded from forecast headroom elsewhere: $0.8 million from classrooms and $0.2 million each from utilities and parking.
- Resulting budgets: Laboratory $21.2 million, classrooms $14.2 million, utilities $9.8 million, parking $4.8 million. Portfolio funding stays at $50 million, with $0.5 million forecast headroom.
- Alternative: Defer laboratory scope to reduce cost, if the board accepts the operational consequences.
- Decision needed by: September 15, to authorize the revised work package. Flag the effect of any later approval.
- What it does not fix: The transfer alone will not recover the six-week delay. Confirm whether teaching sessions can use alternative facilities in the meantime, and report the revised opening forecast separately.
How to Present the Portfolio Report to Your Board
Structure the presentation around the portfolio’s overall position, significant changes, and decisions required. Use these steps to guide the discussion:
- Circulate the report before the meeting: Follow the board’s agreed timetable and flag the items requiring a decision so members can review them in advance.
- Open with the portfolio position: Summarize the financial and delivery outlook, then explain the most significant changes since the previous report.
- Prioritize material exceptions: Focus on issues that could affect approved budgets, completion dates, or intended outcomes. Keep routine project updates in supporting material.
- Use visuals to support each point: Show budget versus forecast comparisons, milestone movements, or risk trends. State the reporting date and explain the message each visual conveys.
- Explain the consequences and response: Describe what each issue means for funding, delivery, or operations. Set out the corrective action, accountable owner, and expected timing.
- Make decision requests specific: State what the board is being asked to approve, management’s recommendation, the alternatives, and the deadline. Explain the implications of delaying the decision.
- Confirm decisions and follow-up: Recap approvals, conditions, and unresolved questions. Record action owners and due dates, then reflect the outcomes in the next report.
Report to the board on a fixed cycle, and update projects more often than the board meets. Monthly internal reviews can feed a quarterly board report, with significant exceptions escalated through agreed procedures between meetings.
💡 Pro tip: Set the reporting cutoff a few days before you circulate the pack. That buffer gives project owners time to confirm their figures and gives you room to investigate any late movement before the board sees it.
How to Use Mastt for Project Portfolio Reporting
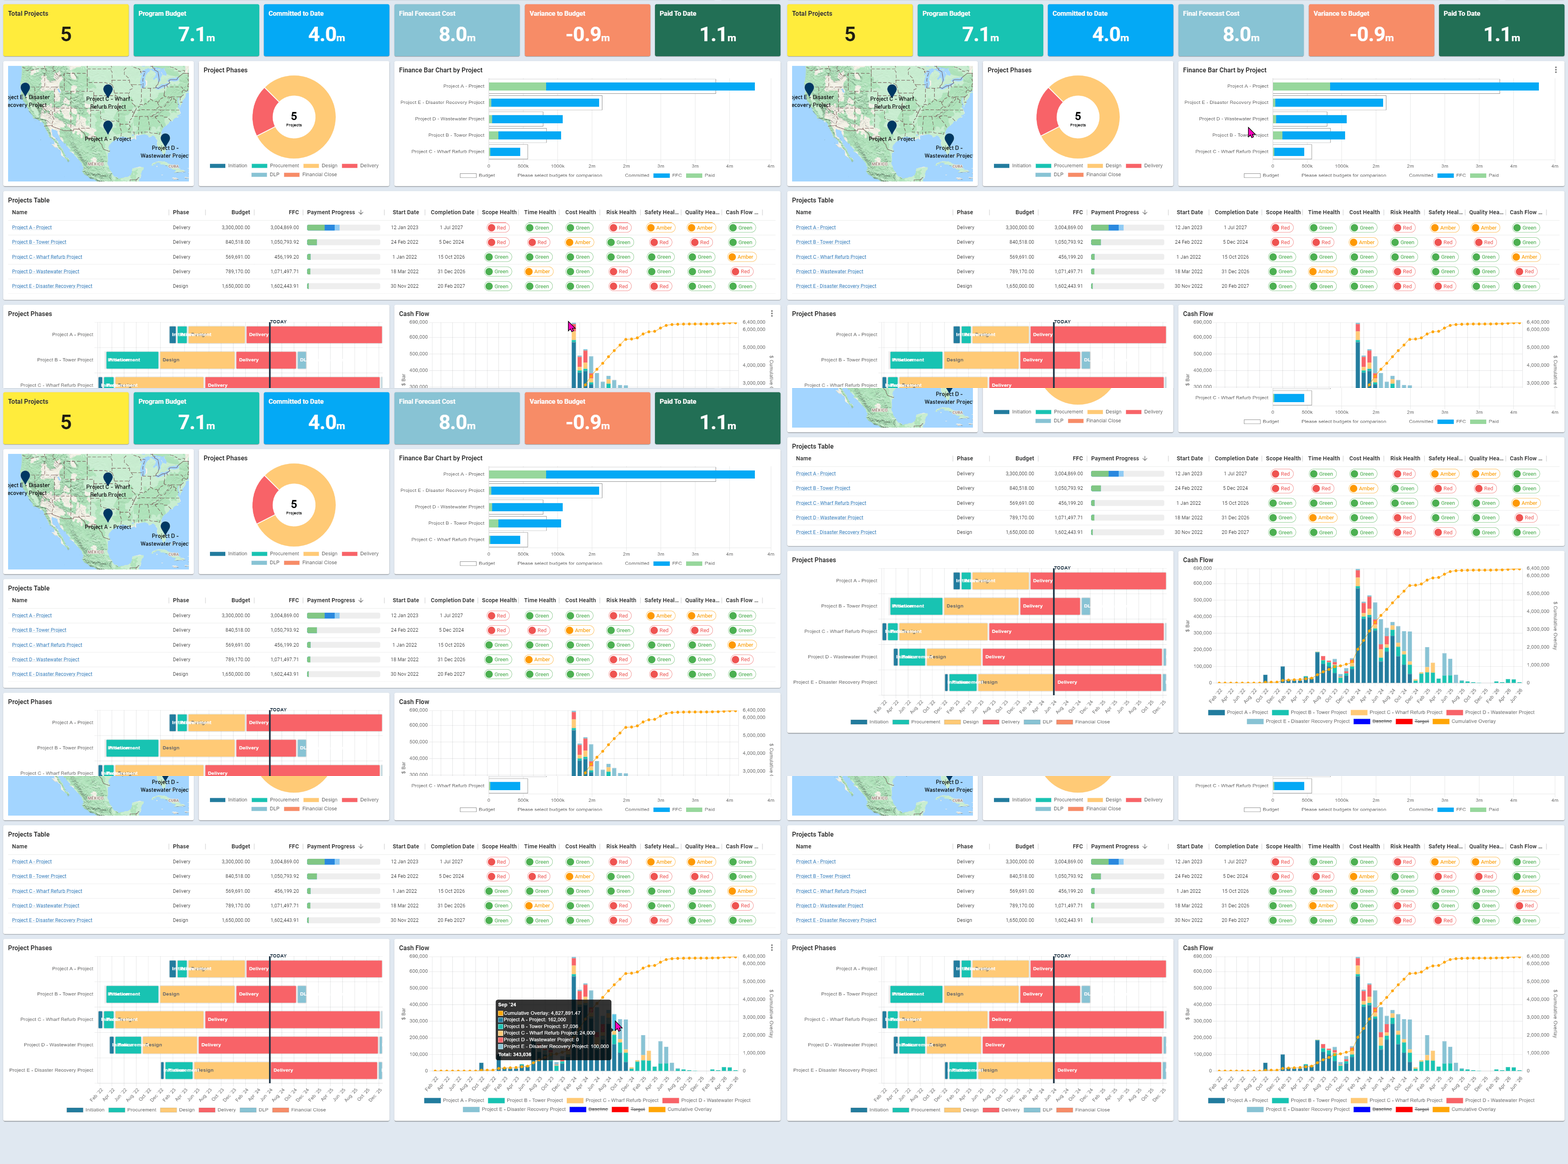
Mastt’s capital program management software consolidates multiple projects into one portfolio view and turns live project data into board-ready reports. It removes the manual consolidation that makes portfolio reporting slow and error-prone.
Here is how to use it at each stage of the report:
- Connect each project once, then let the portfolio roll up: Set up every project's budget, schedule, and risk in Mastt, so they aggregate into a single program or portfolio view, instead of re-merging spreadsheets each cycle.
- Build the cost position from live data: Work from approved budgets and sub-budgets, action the transfers the board approves, and pull a real-time budget-versus-forecast report with cash flow drawn from live payment data.
- Flag exceptions with RAG before the meeting: Use portfolio-wide RAG status to surface the projects that need attention, so the board sees material exceptions against the overall position at a glance.
- Lock a reporting structure every project reuses: Save a best-practice dashboard template and apply it to each project, so figures stay comparable from one period to the next without reformatting.
- Issue the board pack and keep what you presented: Export to PDF or share a secure link, then snapshot and store that issue so you can trace what informed each decision after the live view moves on.
Let the tool build the report, but never issue it unread. Review the consolidated figures before you circulate anything.
Use Mastt's PPM report template as a starting point for your reporting structure. Adapt it to your board's responsibilities, define the reporting cutoff, and check the forecast behind every material exception.
Build Your Next Report Around the Decisions Required
A useful portfolio report connects the investment position with delivery consequences and decisions requiring attention. Its value depends on consistent inputs and clear explanations of significant changes.
For me, it comes back to confidence. A report the team can produce quickly from data already in the system is one you can trust in front of a board, and that trust is what reduces risk.

Written by
Iain Davidson
Iain Davidson is the State Chief Executive for the Australian Capital Territory at Colliers and a member of the firm's Australian Executive Leadership Team. Holding a degree in land economics and a Certified Practicing Project Manager credential, he built Colliers' Canberra project management and government property businesses and has transacted more than 170,000 square meters of property, much of it for the Commonwealth Government. At Mastt, he contributes content on client-side project delivery and the Canberra property market.


Contributions by
.avif)
PPM Report
Use this FREE PPM (Project Portfolio Management) Report Template to track portfolio performance, project metrics, and overall progress. Manage multiple projects effectively in one clear view.

Walk Into Every Meeting With Confidence, Clarity, and Control
No one wants to look unprepared, blindsided, or uncertain in front of stakeholders — but that’s exactly what happens without Mastt.
Start for FreeTrusted by the bold, the brave, and the brilliant across governments, Fortune 500s, and the world’s best in delivering the future