



What is an Advanced Project Dashboard Template?
An Advanced Project Dashboard Template visualizes KPIs, budgets, and timelines in real time, giving construction teams a single source of truth for performance. It brings together cost data, schedules, risks, and contract details in a single, connected view, enabling decisions to be based on the latest information.
Unlike basic dashboards, an advanced project dashboard template integrates live updates from multiple sources and presents them through clear charts, status indicators, and drill-down reports. This structure enables teams to track progress, identify risks early, and maintain stakeholder alignment throughout the project.
What’s Included in an Advanced Project Dashboard Template?
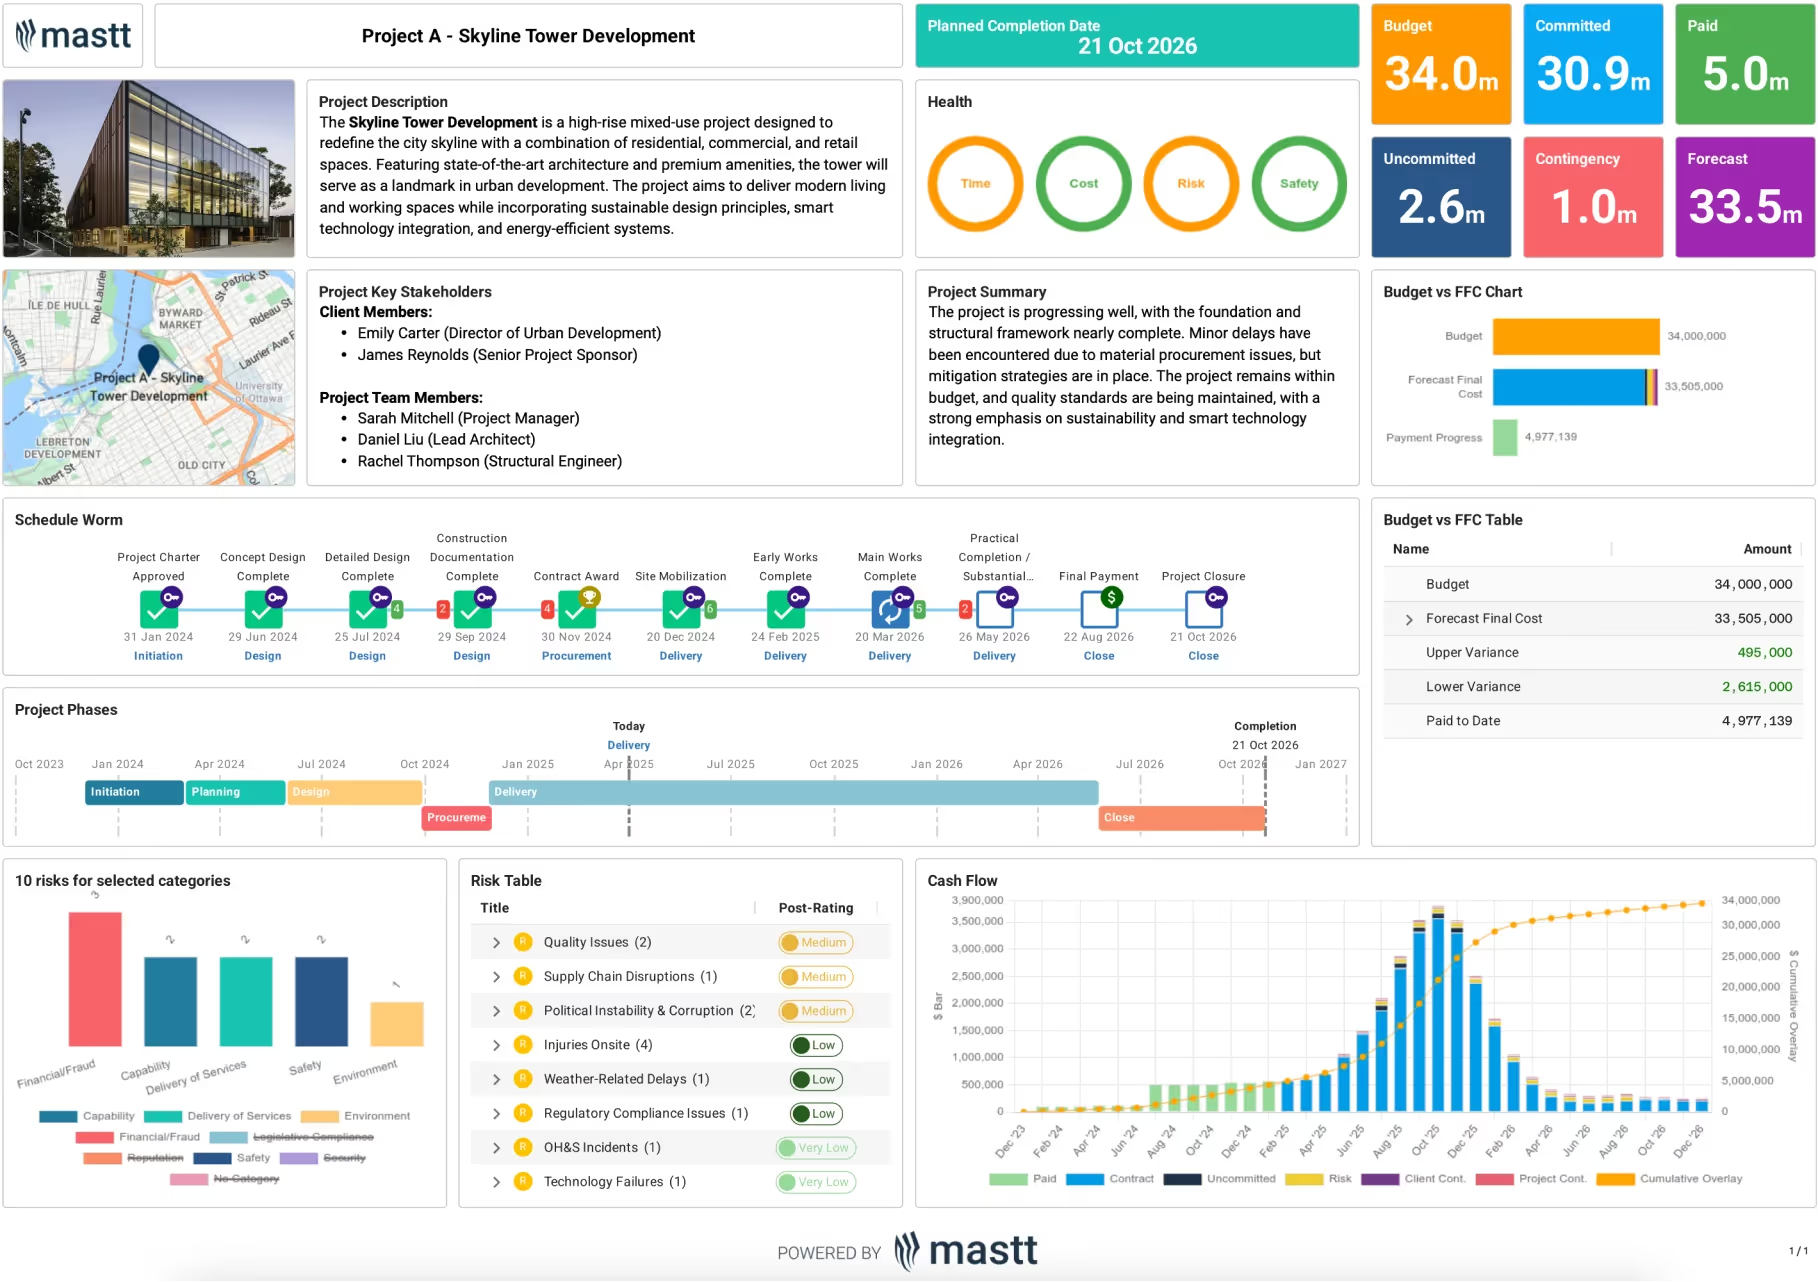
An advanced project dashboard template includes key project data and visualizations in a single, interactive view, allowing stakeholders to instantly understand performance across time, cost, project risks, and safety. Each section is designed to present real-time information without the need to dig through separate reports.
These are the key components included in an advanced project dashboard:
- Project overview section: A summary of the project plan, scope, and key stakeholders, with location mapping for quick context.
- Planned completion date: A clearly displayed target date to anchor all schedules and deliveries.
- Health indicators: Visual charts for metrics, such as time, cost, risk, and safety hazards, giving an immediate read on overall project status.
- Budget status tiles: Live figures for total budget, committed spend, paid to date, uncommitted amounts, contingency, and forecast final cost.
- Budget vs Forecast charts and tables: Side-by-side comparisons of planned vs projected costs, with variance and payment progress.
- Milestone timeline: Icons and dates for key approvals, contract awards, mobilization, construction stages, and final payment.
- Project phases tracker: A horizontal timeline mapping initiation, design, procurement, project delivery, and contract closeout stages.
- Risk dashboard: Bar charts showing top risk categories, plus a detailed risk register with likelihood, impact, and mitigation ratings.
- Cash flow chart: A time-phased visual of paid amounts, committed costs, risks, contingency, and cumulative spend.
By combining these elements in a single, connected view, the advanced project dashboard ensures that every cost, schedule, and risk discussion begins with the same up-to-date information.
Why Use a Template for an Advanced Project Dashboard
A template for an advanced project dashboard gives construction project owners and managers a single, accurate source of truth for performance. By consolidating cost, schedule, risk, and safety data into a single real-time view, it eliminates the need for scattered spreadsheets and outdated reports.
You can use an advanced project dashboard template to:
- Improve visibility: Quickly see where the project stands on budget, schedule, and risk without piecing together multiple updates.
- Streamline reporting: Replace manual status reports with automated visuals and charts that update instantly.
- Support governance and compliance: Maintain an auditable record of all budget changes, project milestones, and risk updates.
- Identify issues early: Spot project delays, cost overruns, or emerging risks before they escalate.
- Align teams and stakeholders: Ensure everyone in the construction team works from the same live data.
For construction projects where scope, budgets, and risks can change rapidly, an advanced project dashboard template helps teams make faster, better-informed decisions with less administrative overhead.
How to Use an Advanced Project Dashboard Template
To use an advanced project dashboard template, set it up with accurate baseline data, assign ownership for updates, and make it part of your regular project management workflow.
- Define your dashboard categories: Decide which data sets matter most for your project, like budgets, schedules, KPIs, construction contracts, or risks, and ensure the dashboard layout includes them.
- Enter baseline information: Populate the dashboard with approved budgets, contract details, planned schedules, risk assessments, and target KPIs. This becomes the benchmark for measuring performance.
- Assign responsibility: Identify who will update each section so data remains current and reliable.
- Update on a set schedule: Refresh the dashboard regularly, whether weekly, monthly, or at major milestones, so reports always reflect the latest progress.
- Use filters and drill-downs: Focus on specific work packages, project phases, or risk categories when preparing reports or investigating performance changes.
- Adapt as the project evolves: Add new KPIs, categories, or visualizations to address shifting priorities or emerging risks.
When maintained consistently, the dashboard becomes a powerful live reporting tool that supports day-to-day decisions and high-level reviews.
Get the Best-Fit Advanced Project Dashboard with Mastt
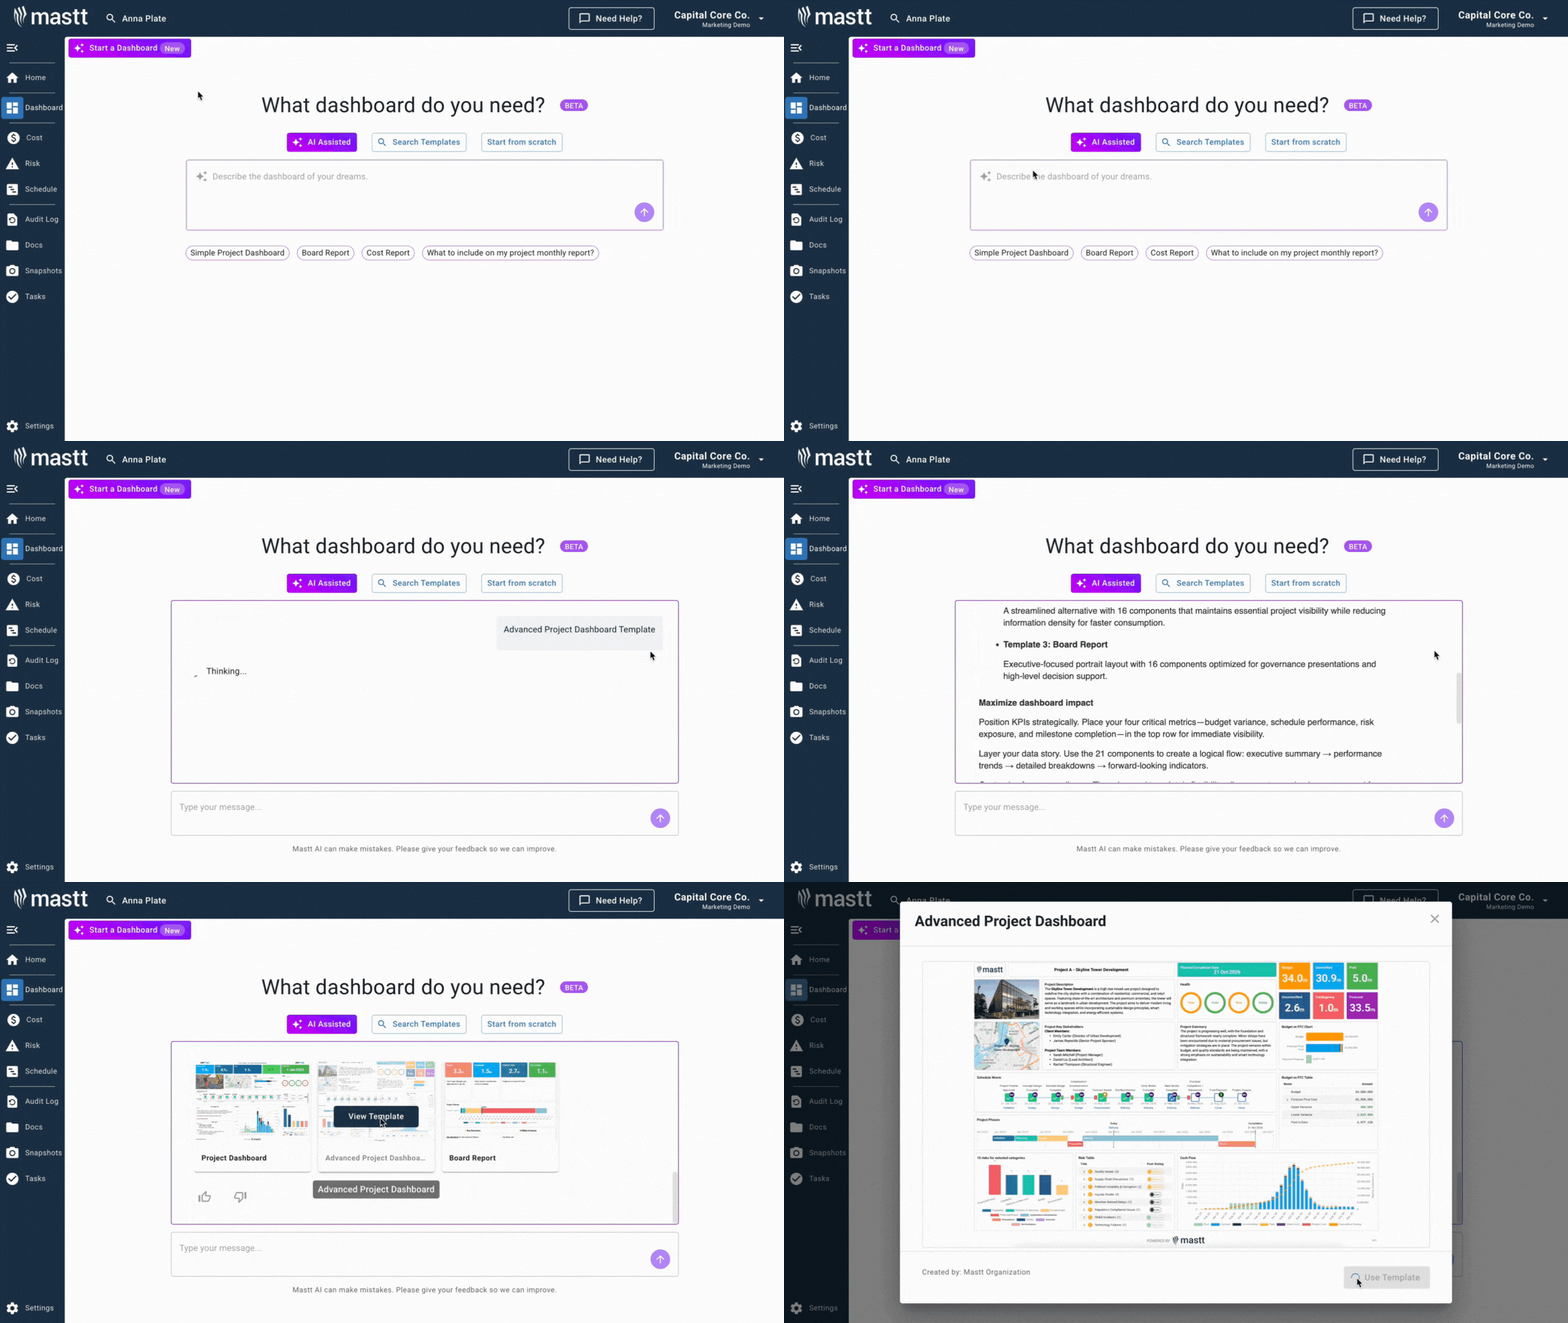
Trying to manage project budgets, schedules, and KPIs across multiple spreadsheets or disconnected systems is a quick path to confusion. Mastt’s Dashboard module brings budgets, milestones, risks, and commentary into a shareable report. Its AI Dashboard Creator can suggest a new layout for you to review and customize.
When to Use an Advanced Project Dashboard Template
Use an advanced project dashboard template when you need budgets, schedules, risks, and KPIs in one connected view. It’s especially effective during key milestones, scope changes, and reporting cycles where decisions depend on accurate, up-to-date information.
You’ll get the most benefit from an advanced project dashboard during:
- Stage gates and approvals: Present stakeholders with a live, visual summary of progress, forecast performance, and outstanding issues.
- Scope changes: Track the impact of design changes, change orders, or contract amendments on cost, schedule, and risk in real time.
- Portfolio reviews: Compare performance across multiple projects using the same metrics and dashboard structure.
- Reporting cycles: Quickly produce accurate, audit-ready updates without reformatting data.
- Risk escalation: Monitor critical risks closely, with immediate visibility into mitigation progress and potential cost or schedule impacts.
💡 Pro Tip: Using an advanced project dashboard at these points ensures that you can communicate with confidence, act quickly on emerging issues, and maintain stakeholder trust throughout the delivery process.
Common Problems with Manual Dashboards
Manual dashboards lack the connected, real-time capabilities needed for effective project control. They often leave construction teams with fragmented insights instead of a single, accurate view of performance.
⚠️ Limited data integration: Budget, schedule, risk, and KPI data are managed separately, preventing a clear, unified view.
⚠️ Outdated performance metrics: Without live updates, dashboards show yesterday’s numbers instead of current progress.
⚠️ No drill-down capability: Basic dashboards can’t link summary metrics to underlying contract, cost, or milestone details.
⚠️ Static visuals: Charts and status indicators don’t update automatically, requiring manual effort to refresh.
⚠️ Poor cross-project comparability: Inconsistent formats make portfolio-level reporting difficult.
⚠️ Gaps in accountability: Without clear ownership mapping, it’s harder to track who is responsible for each KPI or milestone.

Written by
Jackson Row
Jackson Row joined Mastt's founding North American team in 2023, implementing the platform for US government agencies and Fortune 500 organizations. He holds a Bachelor of Engineering in civil and mining engineering from UNSW and began his career as a construction cadet on civil projects in Sydney. At Mastt, he contributes articles on payment and client-side project management.

Use this FREE Advanced Project Dashboard Template to monitor complex projects with precision. Track KPIs, budget, schedule, risks, and performance metrics in one dynamic, visual report.

Top Performers Don’t Guess. They Deliver.
Cut the stress of showing up unprepared
Start for FreeTrusted by the bold, the brave, and the brilliant to deliver the future