


What is a Cost Benefit Analysis Template?
A cost benefit analysis template is a pre-built spreadsheet that weighs the total cost of a project against the total benefit it delivers, with both converted into today's money. You enter your costs and benefits, set a discount rate, and it returns a net present value and benefit cost ratio you can put in front of a decision maker.
Cost benefit analysis, or CBA, is how capital investment gets justified in government, infrastructure, and any organization choosing between competing projects. Working from a template means you are not rebuilding the discounting maths every time, and it keeps the structure consistent for whoever has to review your assumptions later.
What's Inside the Excel Workbook
Twelve sheets, all driven from a single control sheet.
The color coding runs through every sheet. White cells are yours to fill in, tinted blue cells are assumptions you need to evidence, and off-white cells hold formulas that should be left alone.
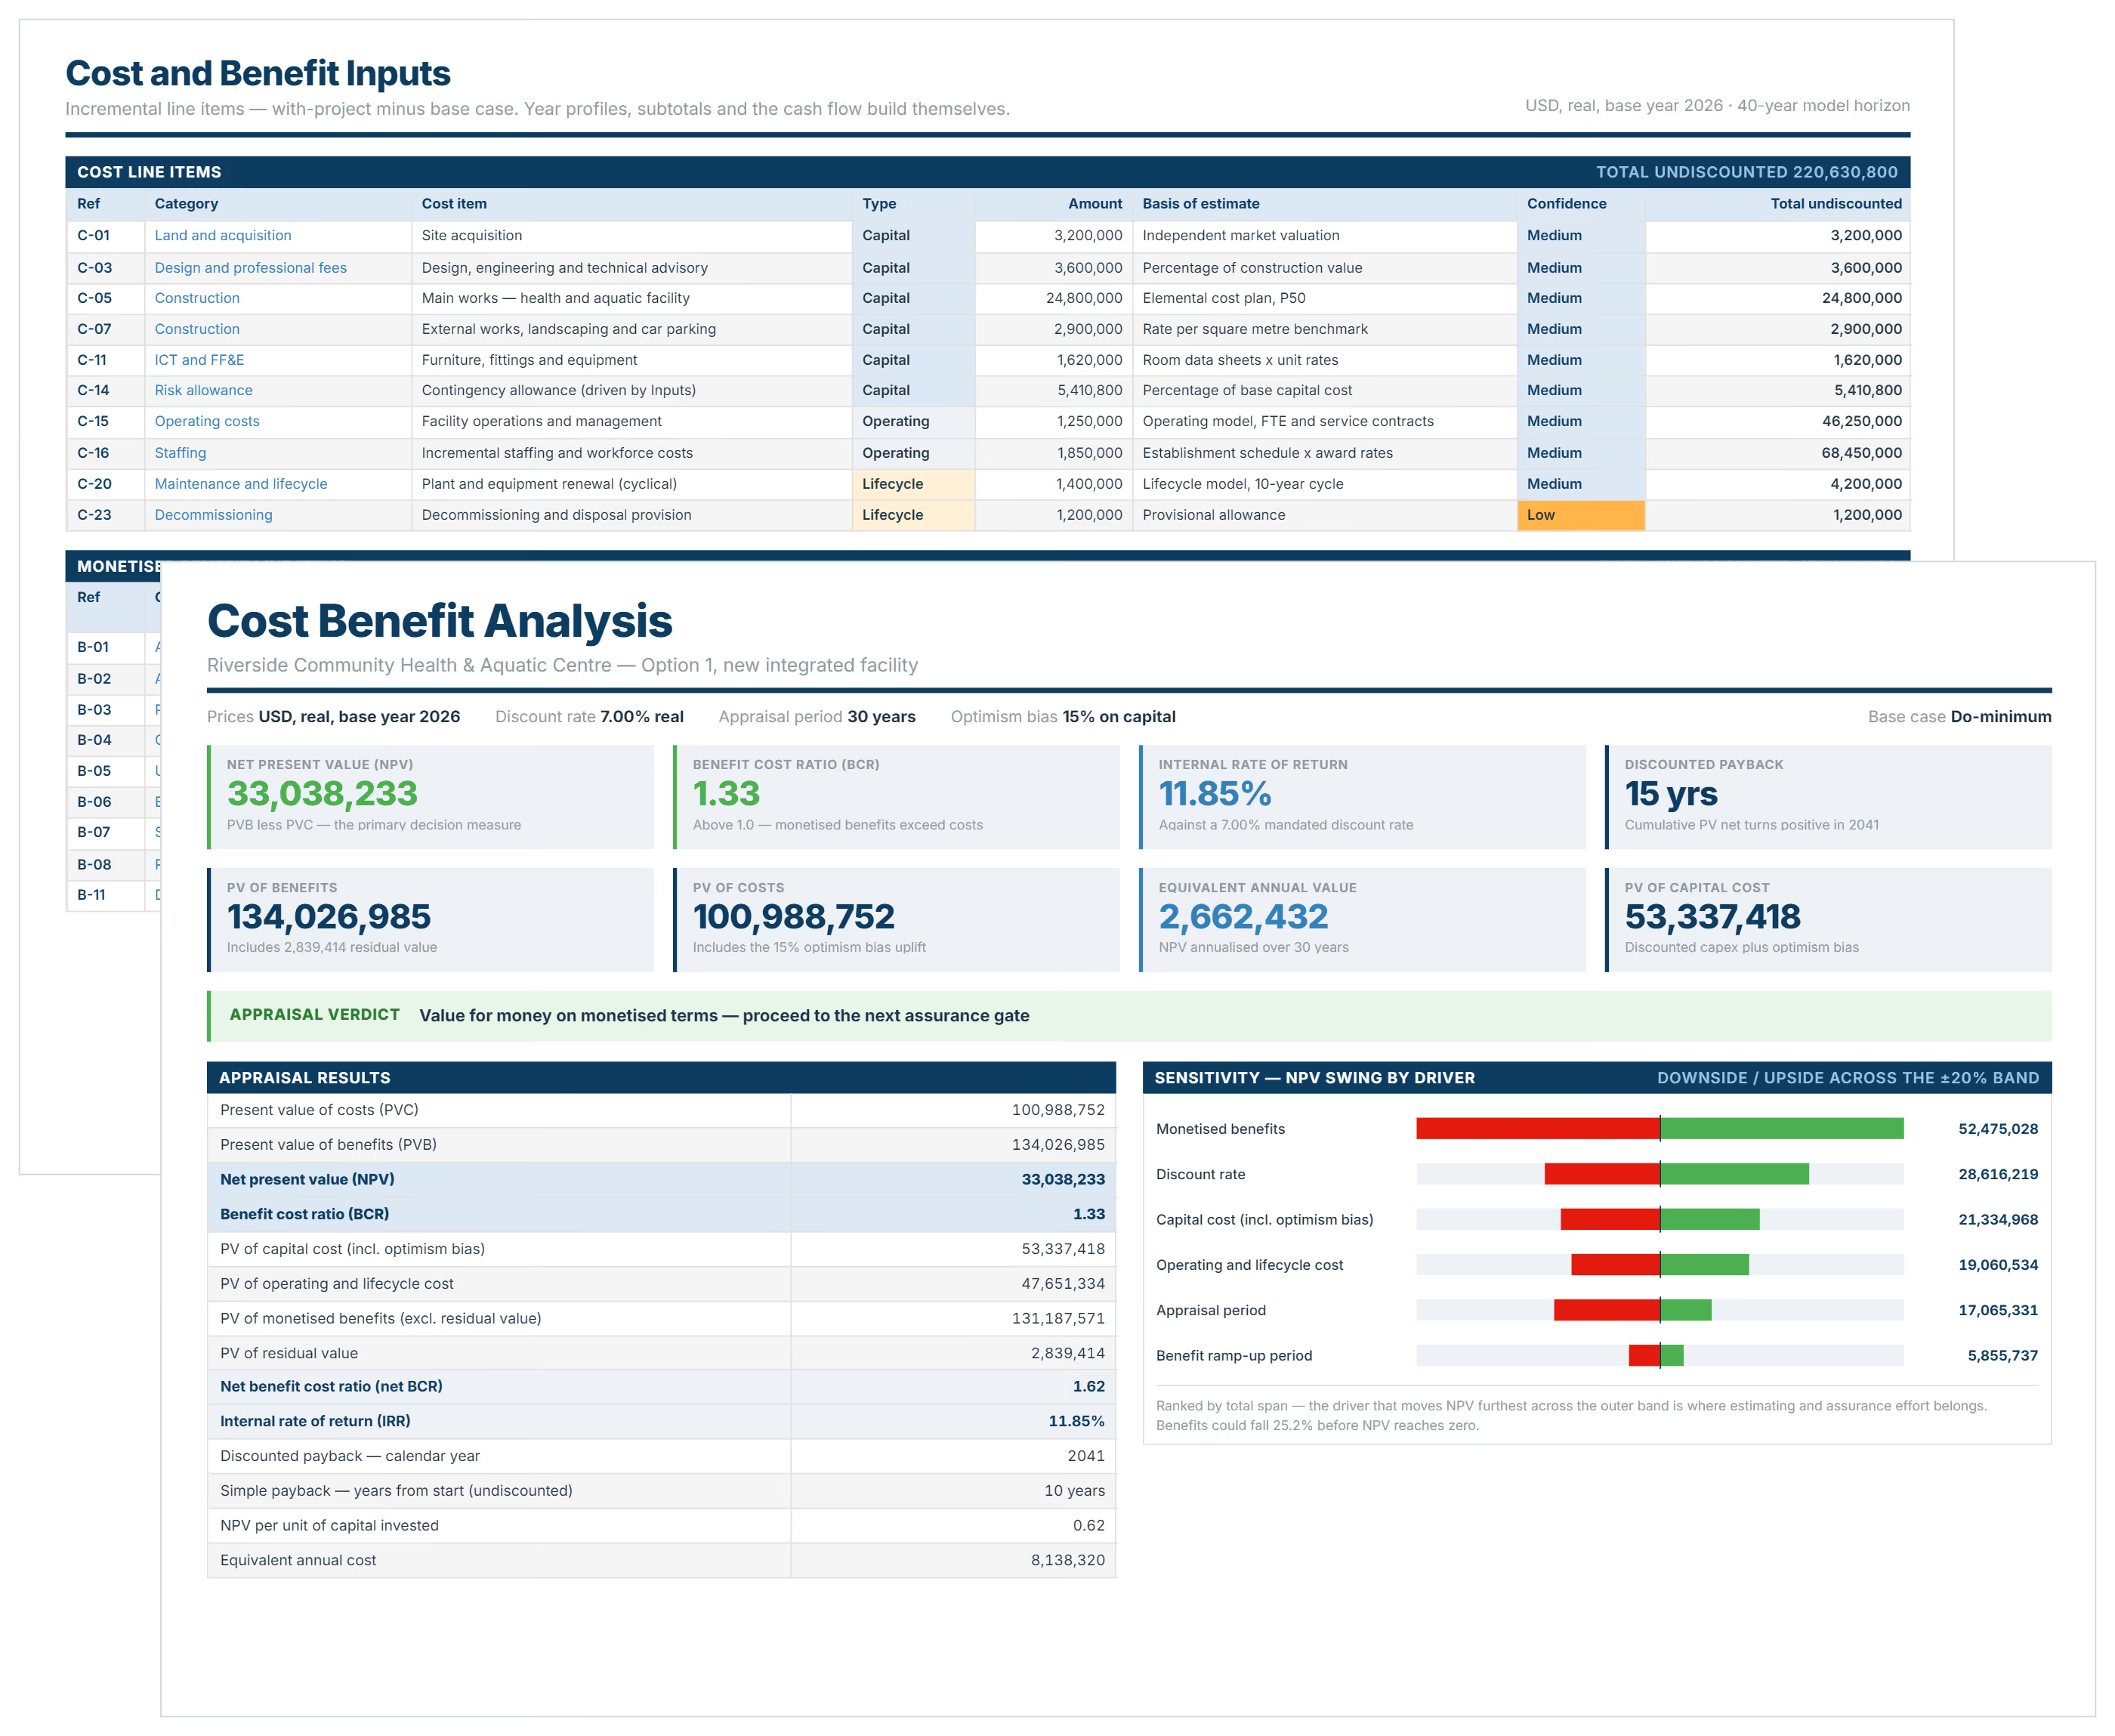
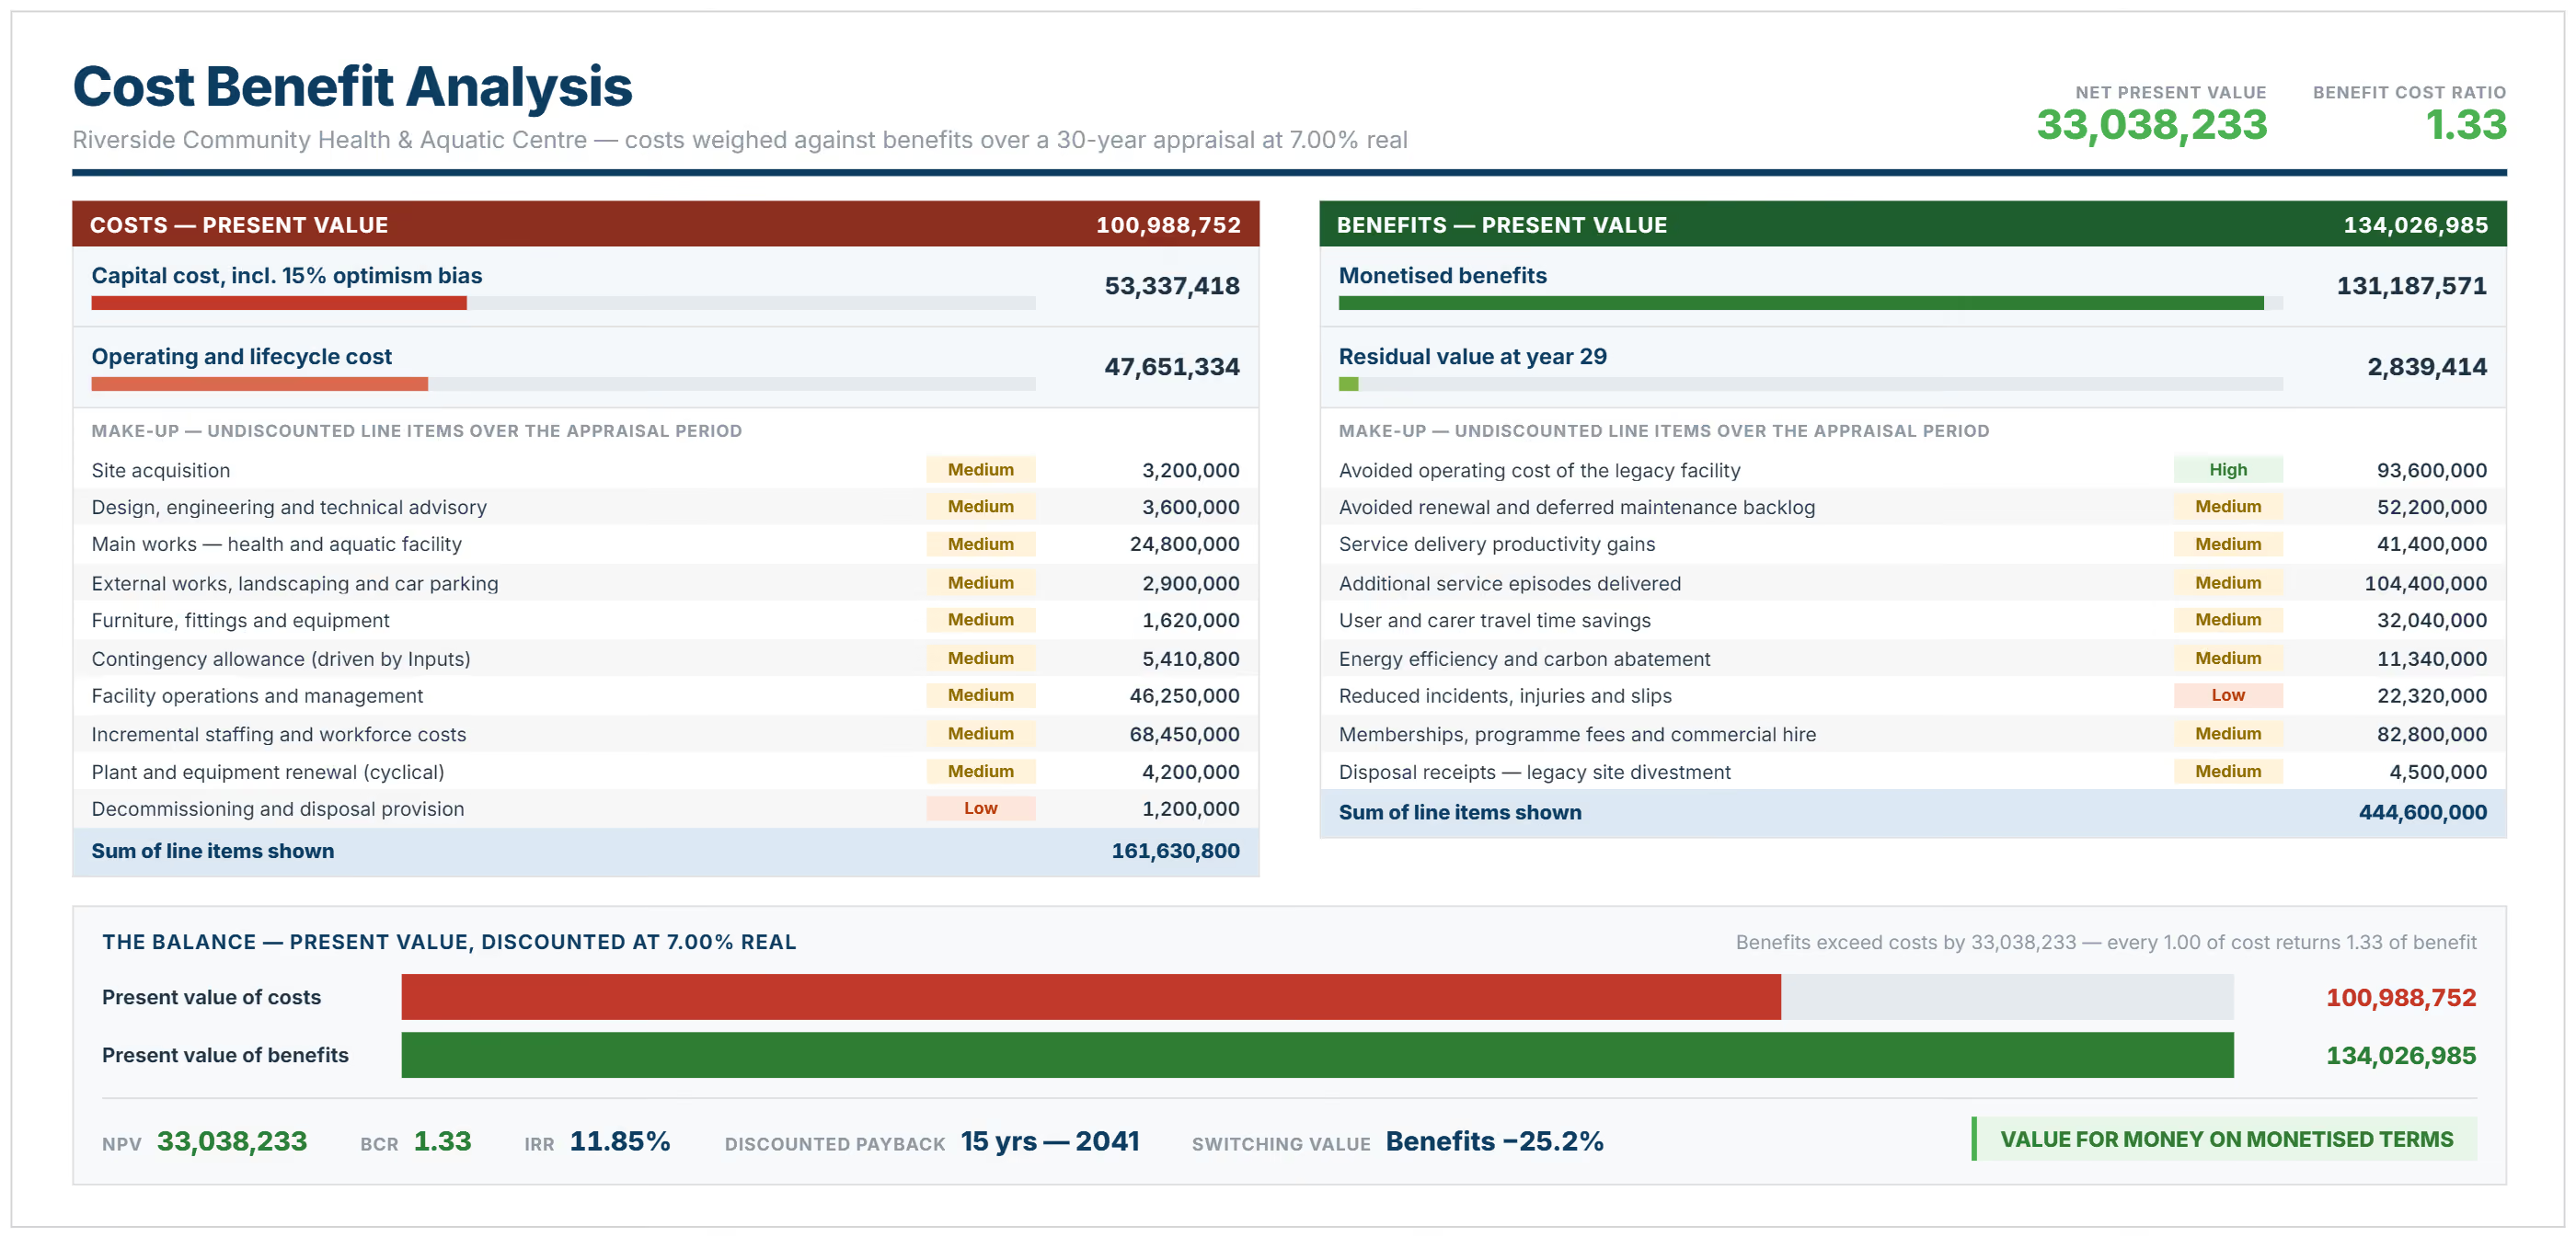
The workbook opens on a worked example for a community health and aquatic centre, so you can see a finished appraisal before clearing it out and entering your own numbers.
How to Do a Cost Benefit Analysis in Excel
Set your drivers on the Inputs & Assumptions sheet, replace the example cost and benefit lines, then read the result off the Results sheet. The year profiles, subtotals and cash flow all build themselves from what you enter.
Have your discount rate, appraisal period and cost estimate ready before you open it, since everything downstream depends on those three.
- Set the project name, currency, price base year, appraisal period and the real discount rate your jurisdiction mandates. The 7% shown is a placeholder rather than a recommendation
- Set the optimism bias uplift, contingency budget percentage, residual value method, benefit ramp-up and carbon price
- Replace the example cost lines, tagging each one as Capital, Operating or Lifecycle and recording its basis of estimate
- Replace the benefit lines with the annual value at full realization, the valuation basis, and where the supporting evidence comes from
- Read NPV, BCR, IRR and payback on the Results sheet, then record the impacts you could not reasonably put a number against
- Check the switching values on the Sensitivity sheet, and build the quantified risk register on the Risk & Optimism Bias sheet
Everything in the model is incremental, which means with-project minus base case. Your base case is the do-minimum rather than do nothing, so it still carries whatever spend keeps the existing asset safe and operating.
Anything that would happen under both scenarios is excluded from the analysis, because it makes no difference to the decision.
How to Read the Cost Benefit Analysis Table
The results table is built from five calculations.
NPV is what makes the decision, while BCR is for ranking one option against another. Anything with a BCR between 1.0 and 1.2 sits inside the error band of a typical appraisal, so treat it as marginal until the switching values support it.
A switching value is how far a single input can move before NPV falls to zero, and a case where benefits can only drop 8% before it fails is a fragile one no matter how the headline ratio reads.
Do You Need All Twelve Sheets?
Four of them give you a complete appraisal: Inputs, Cost Inputs, Benefit Inputs and Results. If what you want is a simple cost benefit analysis in Excel, use those four and leave everything else untouched.
The remaining sheets earn their place once the decision comes under scrutiny. Sensitivity and switching values show how much your answer can take before it flips.
The risk register tests whether the contingency you have set actually covers what could go wrong. Distributional analysis sets out who carries the cost and who receives the benefit, which tends to be one of the first things a board wants to see.
The overall structure follows the common ground between HM Treasury's Green Book, Infrastructure Australia's assessment framework, the European Commission's CBA Guide and World Bank appraisal practice, without committing you to any one of them.
Related Articles and Templates
.avif)
Written by
Doug Vincent
Doug Vincent is the co-founder and CEO of Mastt, the AI capital-project management platform used by governments, Fortune 500 companies, and consultancies across APAC, North America, and MENA. Before founding Mastt in 2019, he spent a decade at RPS delivering more than $2 billion in capital works, including the $2.1B Defence Navy Infrastructure program, and holds a CPSPM certification with the AIPM. He contributes content and speaks on AI in capital project delivery at Mastt.

Use this cost-benefit analysis template to justify investments and secure funding. Quantify returns, compare options, and demonstrate ROI before committing resources.

Top Performers Don’t Guess. They Deliver.
Cut the stress of showing up unprepared
Start for FreeTrusted by the bold, the brave, and the brilliant to deliver the future