
What is a Project Health Dashboard?
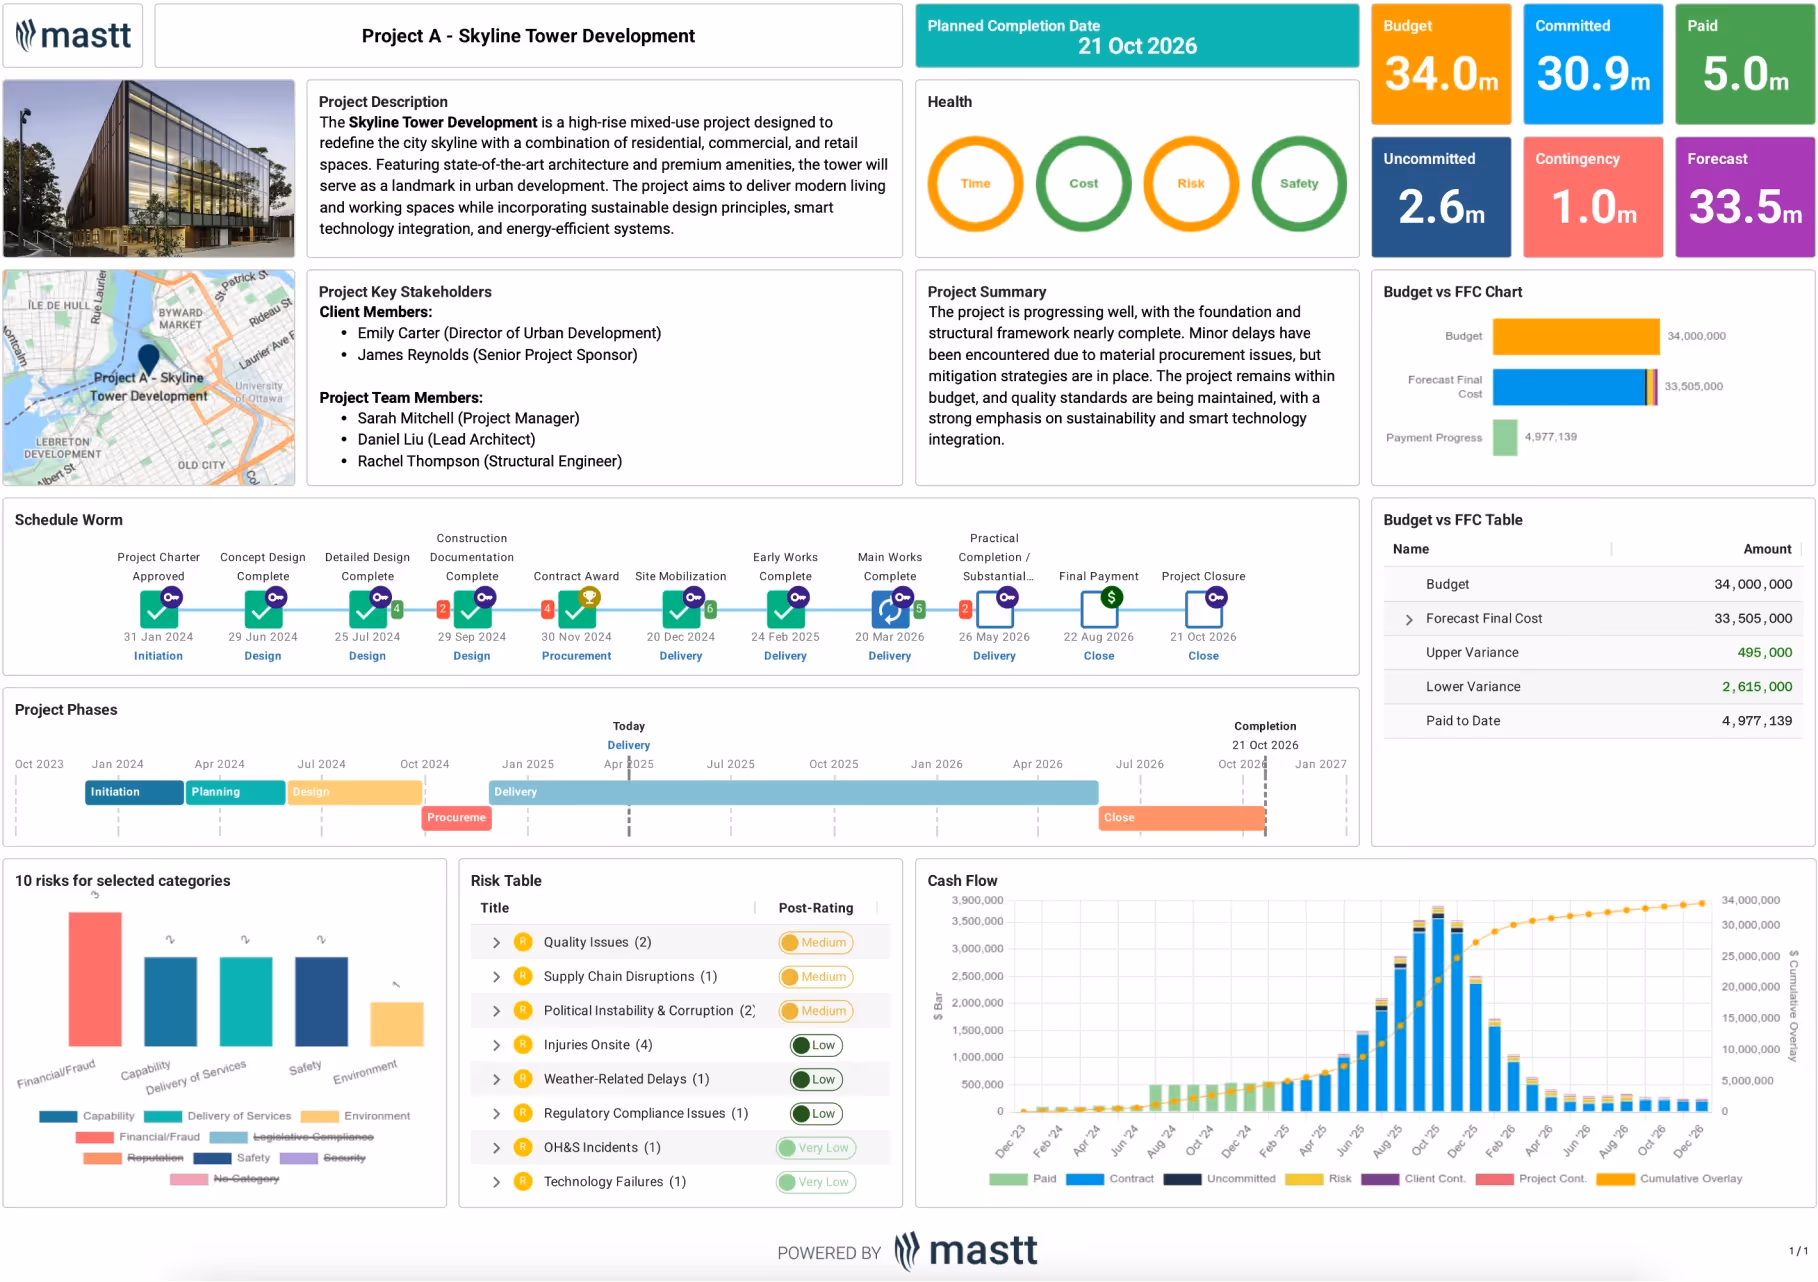
A project health dashboard is a visual interface that displays real-time performance metrics across cost, schedule, quality, and risk in one centralized view. It consolidates scattered project data into traffic-light indicators and KPIs so teams instantly see what's on track and what needs attention.
Think of it as your project's vital signs monitor. Just like doctors track heart rate and blood pressure, project teams use dashboards to monitor budget variance, milestone completion, and risk exposure. Instead of digging through Excel files or waiting for monthly reports, you get immediate answers to critical questions: Are we over budget? Is the critical path slipping? Which risks are escalating?
Dashboards pull live data directly from project systems, so no manual updates are required. When a change order gets approved or a progress payment is processed, your dashboard reflects it immediately. This real-time connection transforms how teams manage delivery, shifting from reactive problem-solving to proactive control that prevents small issues from becoming expensive failures.
What's Included in Project Health Dashboards?
An ideal project health dashboard balances comprehensive tracking with focused decision-making, showing performance indicators that actually trigger action rather than burying teams in useless data. Each component serves a specific purpose: revealing problems early enough to fix them while costs remain manageable and schedule recovery stays feasible.
Essential elements that separate effective dashboards from cluttered spreadsheets are:
- RAG Status Indicators: Traffic light colors instantly show which areas run smoothly (green), need watching (amber), or require immediate intervention (red) across budget, schedule, risk, and quality.
- Budget Variance Analysis: Real-time tracking compares approved budget against forecast final cost, displaying percentage deviation and dollar amounts with trend indicators showing whether gaps are closing or widening.
- Schedule Performance Metrics: Current milestone status against baseline dates, critical path delays measured in days, and SPI calculations revealing whether you're gaining or losing ground.
- Earned Value Indicators: Automated CPI and SPI calculations derived from actual costs and work completed, eliminating manual EVM spreadsheet updates that drain project controls resources.
- Risk Exposure Totals: Sum of all active risk values weighted by probability, categorized by severity, with mitigation ownership clearly assigned to prevent risks from slipping through cracks.
- Milestone Tracking: Visual progress bars for major deliverables including design approvals, procurement packages, construction phases, and practical completion with baseline comparisons.
- Performance Trend Charts: Historical graphs showing cost variance, schedule variance, and risk exposure over time so patterns become visible before they become crises.
💡 Pro Tip: Add a "contingency remaining" gauge that shows both percentage and dollar value left in your buffer. When this drops below 15% before you're 85% complete, your project needs immediate cost controls - not next month, today.
Why Use Dashboards for Project Health?
Manual status reporting creates a dangerous lag between problems emerging and teams learning about them. By the time someone compiles an Excel report, budget overruns have consumed weeks of contingency and schedule delays have pushed into critical path activities.
Dashboards eliminate this lag. Problems appear immediately. Decisions happen faster. Projects stay on track.
Specific advantages of project health dashboards that drive better outcomes are:
- Early Problem Detection: Spot a subcontractor falling behind schedule within days instead of discovering delays during month-end reviews when recovery options have narrowed significantly.
- Faster Decision Cycles: Cut intervention time from weeks to days by seeing variance the moment it occurs, not after finance closes monthly books.
- Executive Confidence: Board members get clear answers without wading through 50-page status reports, improving approval speed for additional funding or scope changes.
- Eliminated Reporting Burden: Project managers reclaim 8-12 hours monthly previously spent copying data between spreadsheets, time now available for actual project management work.
- Portfolio Comparison: Standardized KPIs across multiple projects reveal which initiatives need support and which teams consistently deliver, enabling smarter resource allocation decisions.
- Proactive Risk Response: Real-time risk exposure calculations trigger alerts when cumulative probability exceeds thresholds, forcing mitigation before risks materialize into actual delays or cost impacts.
- Single Source of Truth: Everyone from project owners to contractors sees identical numbers, eliminating the "which version is correct" debates that waste meeting time.
- Improved Forecasting: Continuous earned value tracking produces more accurate completion estimates than periodic manual calculations that introduce calculation errors and stale assumptions.
💡 Pro Tip: Configure your dashboard to send automated weekly digests every Friday afternoon. This forces team members to update data before the weekend, ensuring Monday morning reviews start with fresh numbers instead of week-old information.
How to Use a Project Health Dashboard?
Getting value from dashboards requires more than just displaying data because you need the right metrics, proper thresholds, and disciplined review cadences. Teams that treat dashboards as passive displays waste the opportunity. Active dashboard management transforms raw numbers into corrective actions.
Here's how to deploy project health dashboards effectively:
- Select Decision-Driving Metrics: Choose 5-7 KPIs that actually trigger interventions for your delivery method rather than tracking everything possible and overwhelming stakeholders with noise.
- Calibrate RAG Thresholds: Set green-amber-red boundaries based on your risk tolerance - typically green within 5%, amber between 5-10%, red beyond 10% for both cost and schedule variance.
- Integrate Data Sources: Connect your cost tracker, schedule system, and risk register so dashboards populate automatically without manual data entry creating lag and errors.
- Configure User Permissions: Customize what executives, project managers, and contractors see based on their decision authority to prevent information overload while maintaining appropriate transparency.
- Establish Review Rhythm: Schedule 15-minute weekly dashboard reviews focusing exclusively on amber and red indicators instead of hour-long meetings covering everything including green items.
- Enable Drill-Down Access: Ensure dashboard links connect to detailed registers so teams can investigate variance root causes and document corrective actions immediately.
- Monitor Performance Trends: Track whether variances are improving or worsening across successive periods rather than treating each report as an isolated snapshot.
- Generate Stakeholder Reports: Export dashboard views directly for board presentations instead of recreating the same information in PowerPoint decks.
- Refresh Metrics Quarterly: Review which KPIs successfully predicted problems and adjust dashboard content to improve early warning accuracy based on lessons learned.
💡 Pro Tip: Build a "time to green" metric that tracks how long items stay amber or red before returning to acceptable performance. Projects averaging more than three weeks indicate your intervention processes are too slow or ineffective.
Get the Best-Fit Project Health Dashboard with Mastt's AI Template Studio
Most teams waste hours configuring dashboard layouts, choosing chart types, and determining which KPIs matter most for their project type. Mastt's AI Template Studio eliminates this setup burden by generating construction-specific dashboards pre-loaded with proven metrics that you customize instantly instead of building from blank spreadsheets.
Here's what AI Template Studio delivers instantly:
🚀 Access Construction-Specific Templates: Browse proven dashboard layouts and templates designed specifically for capital projects, infrastructure programs, and building construction with metrics that matter in real delivery.
🎯 Match Your Project Type: AI recommends dashboard configurations that fit your project scope and monitoring priorities, ensuring you start with the right structure immediately.
⚡ Launch With Complete Structure: Generate dashboards containing budget variance tracking, milestone status indicators, risk summaries, and earned value metrics ready for your project data immediately.
📊 Customize Visual Hierarchy: Adjust chart sizes, gauge ranges, and traffic light thresholds to emphasize the KPIs your leadership team prioritizes during governance reviews.
🔄 Connect Live Project Data: Link dashboards directly to Mastt's Cost Module and integrated registers so every metric updates automatically as work progresses and invoices get approved.
Skip the spreadsheet wrestling. Get professional project management dashboards configured correctly from day one.
Deploy your dashboard in four steps:
- Launch AI Template Studio: From your Mastt workspace, click Start a Dashboard and select AI Assisted to open the intelligent template search.
- Describe Your Project Needs: Enter "project health dashboard" or describe your monitoring priorities like "construction status tracking with earned value" for targeted recommendations.
- Preview Template Options: Review AI-suggested dashboards, click Preview to examine metrics and layout, then choose the configuration matching your governance requirements.
- Customize and Activate: Select Use This Template, map your project data to dashboard fields, and refine sections as priorities evolve through project phases.
Learn more in the Mastt Help Center to discover additional customization options and get the most from AI Template Studio.
Who Should Use a Construction Project Health Dashboard?
Every construction role that touches performance monitoring, budget decisions, or stakeholder reporting benefits from dashboard visibility. The same data serves different purposes depending on your responsibility level and decision authority.
✅ Project Owners and Developers managing portfolio investments need instant visibility across multiple projects to identify which assets require capital injection and which generate concerning variance trends.
✅ Client-Side Project Managers use dashboards to track contractor milestone performance and progress payments against approved schedules without chasing weekly progress reports via email.
✅ Program Managers coordinating related projects rely on standardized dashboard formats to compare performance metrics, identify systemic delivery problems, and reallocate resources strategically.
✅ Project Controls Teams extract earned value data directly from dashboards for cost tracking and variance analysis instead of manually reconciling multiple data sources into EVM calculations.
✅ Executive Leadership including C-suite and board members scan dashboard summaries during governance reviews to spot exceptions requiring strategic decisions without drowning in operational detail.
✅ PMO Directors establish consistent reporting standards across the organization using dashboard templates that enforce governance discipline and enable meaningful project comparisons.
✅ Project Consultants and Independent Certifiers access dashboards to rapidly assess project health for oversight reports and recommendations to clients.
When to Use Project Health Monitoring Dashboards?
Waiting until problems appear before implementing dashboard tracking guarantees you're already behind schedule or over budget. The projects that need dashboards most are the ones that don't have them yet. Smart teams deploy visibility early, before the first sign of trouble appears.
Critical moments that demand immediate dashboard implementation are:
- Contract Execution: Activate dashboard tracking within the first week post-award to capture baseline performance from day one rather than trying to reconstruct historical data later.
- Design Phase Transitions: Monitor design milestone completions and scope changes during design development when decisions still remain flexible and rework costs stay manageable.
- Construction Commencement: Track subcontractor mobilization performance, early material commitments, and initial payments as field activities ramp up rapidly during the first 90 days.
- Portfolio Growth: Standardize construction reporting immediately when managing your second simultaneous project to establish consistent comparison metrics before reporting formats diverge.
- Governance Escalation: Respond to board questions about project trajectory with live data dashboards instead of scrambling to compile one-off reports from scattered sources.
- Contingency Pressure: Deploy enhanced tracking when your contingency drawdown rate exceeds 1% per week or forecast final cost approaches within 10% of approved budget.
- Schedule Slippage: Implement daily visibility when critical path activities fall more than five days behind baseline and recovery planning becomes urgent.
- Change Order Volume Spikes: Activate change tracking when pending chenges exceed 5% of contract value or approval cycles start creating payment disputes.
💡 Pro Tip: The best time to implement a project health dashboard was at project kickoff. The second-best time is today. Projects that deploy monitoring dashboards reactively after problems emerge spend six weeks catching up on data entry instead of managing recovery efforts.
Common Problems with Project Health Tracking Dashboards in Excel
Excel-based performance tracking creates illusions of control while actual project health deteriorates undetected. Spreadsheets can't pull live data. They require manual updates. They break when formulas get corrupted. By the time someone realizes the numbers are wrong, decisions have already been made based on bad information.
Real problems plaguing Excel dashboards include:
- ⚠️ Stale Information Syndrome: Weekly compilation cycles mean dashboards show project status from 7-14 days ago, missing the critical intervention window when problems are still fixable at reasonable cost.
- ⚠️ Formula Corruption Chaos: One person accidentally deletes a formula reference and suddenly variance calculations are wrong for three weeks before anyone notices during reconciliation.
- ⚠️ Formatting Inconsistency: Each project manager uses different Excel templates making portfolio comparison impossible without manually reformatting every spreadsheet to match.
- ⚠️ Massive Time Drain: Project controls specialists spend 10-15 hours monthly copying data between systems, reconciling mismatches, and reformatting charts instead of analyzing actual performance.
- ⚠️ Zero Drill-Down Capability: Static PDF exports prevent stakeholders from investigating what's driving red variance numbers, forcing follow-up meetings to answer basic questions.
- ⚠️ Version Control Nightmare: Five different Excel versions circulate via email with conflicting numbers, destroying stakeholder confidence in any reported metrics.
- ⚠️ Reactive Problem Discovery: Manual reporting cadences guarantee you discover budget overruns or schedule delays weeks after they occur when recovery options have already narrowed significantly.
- ⚠️ Missing Trend Analysis: Excel snapshots don't automatically track whether performance is improving or deteriorating, requiring manual chart creation to visualize patterns over time.
💡 Pro Tip: Calculate your "reporting overhead ratio" or the total hours spent on dashboard creation divided by total project management hours. If this exceeds 8%, you're spending more time reporting than managing. Integrated systems typically reduce this to 2% or less.

Get Real-Time Project Health Visibility Now with Mastt
Projects fail when problems hide in spreadsheets until it's too late. Contractors fall behind. Budgets blow out. Risks become reality. Manual reporting guarantees you discover issues after intervention options disappear.
Mastt eliminates the lag. Dashboards connect directly to your project data. Metrics update automatically. Everyone sees identical numbers. Decisions happen based on today's performance. From contract award through closeout, you get the visibility that keeps delivery on track.
👉 Stop waiting for status reports. Get instant project visibility. Start building your project health dashboard with Mastt's AI Template Studio today.

Written by
Jackson Row
Jackson Row is the Growth & North American Market Lead at Mastt. With a background in risk modeling, cost forecasting, and integrated project delivery, he helps capital project owners work smarter and faster. Jackson’s work supports better tools, better data, and better outcomes across the construction industry.

Use this FREE project health dashboard to monitor KPIs, budget variance, and schedule performance in real-time. Catch problems early and keep projects on track with instant visibility across cost, schedule, and risk.

Top Performers Don’t Guess. They Deliver.
Cut the stress of showing up unprepared
Start for FreeTrusted by the bold, the brave, and the brilliant to deliver the future