
What is a Project Performance Dashboard?
A project performance dashboard is a visual tool showing real-time metrics across cost, schedule, and quality. It combines data from multiple sources into one interface for instant visibility. Project managers use it to monitor KPIs without manual spreadsheet reports.
Dashboards turn raw data into actionable insights through charts, graphs, and indicators. They show current performance against baselines and forecasts, giving executives quick project health views without long reports.
Modern dashboards connect directly to project management platforms, avoiding version control issues in static Excel files. Teams can drill down from high-level metrics to detailed data for variance analysis. Real-time updates ensure decisions rely on current conditions, not outdated numbers.
What's Included in a Project Performance Dashboard Template?
A project performance dashboard template includes sections like visualization panels and metric fields for monitoring project health across cost, schedule, and performance indicators. The template contains predefined calculation formulas, status displays, and chart layouts that teams populate with their specific project data.
Core sections included in performance dashboard templates are:
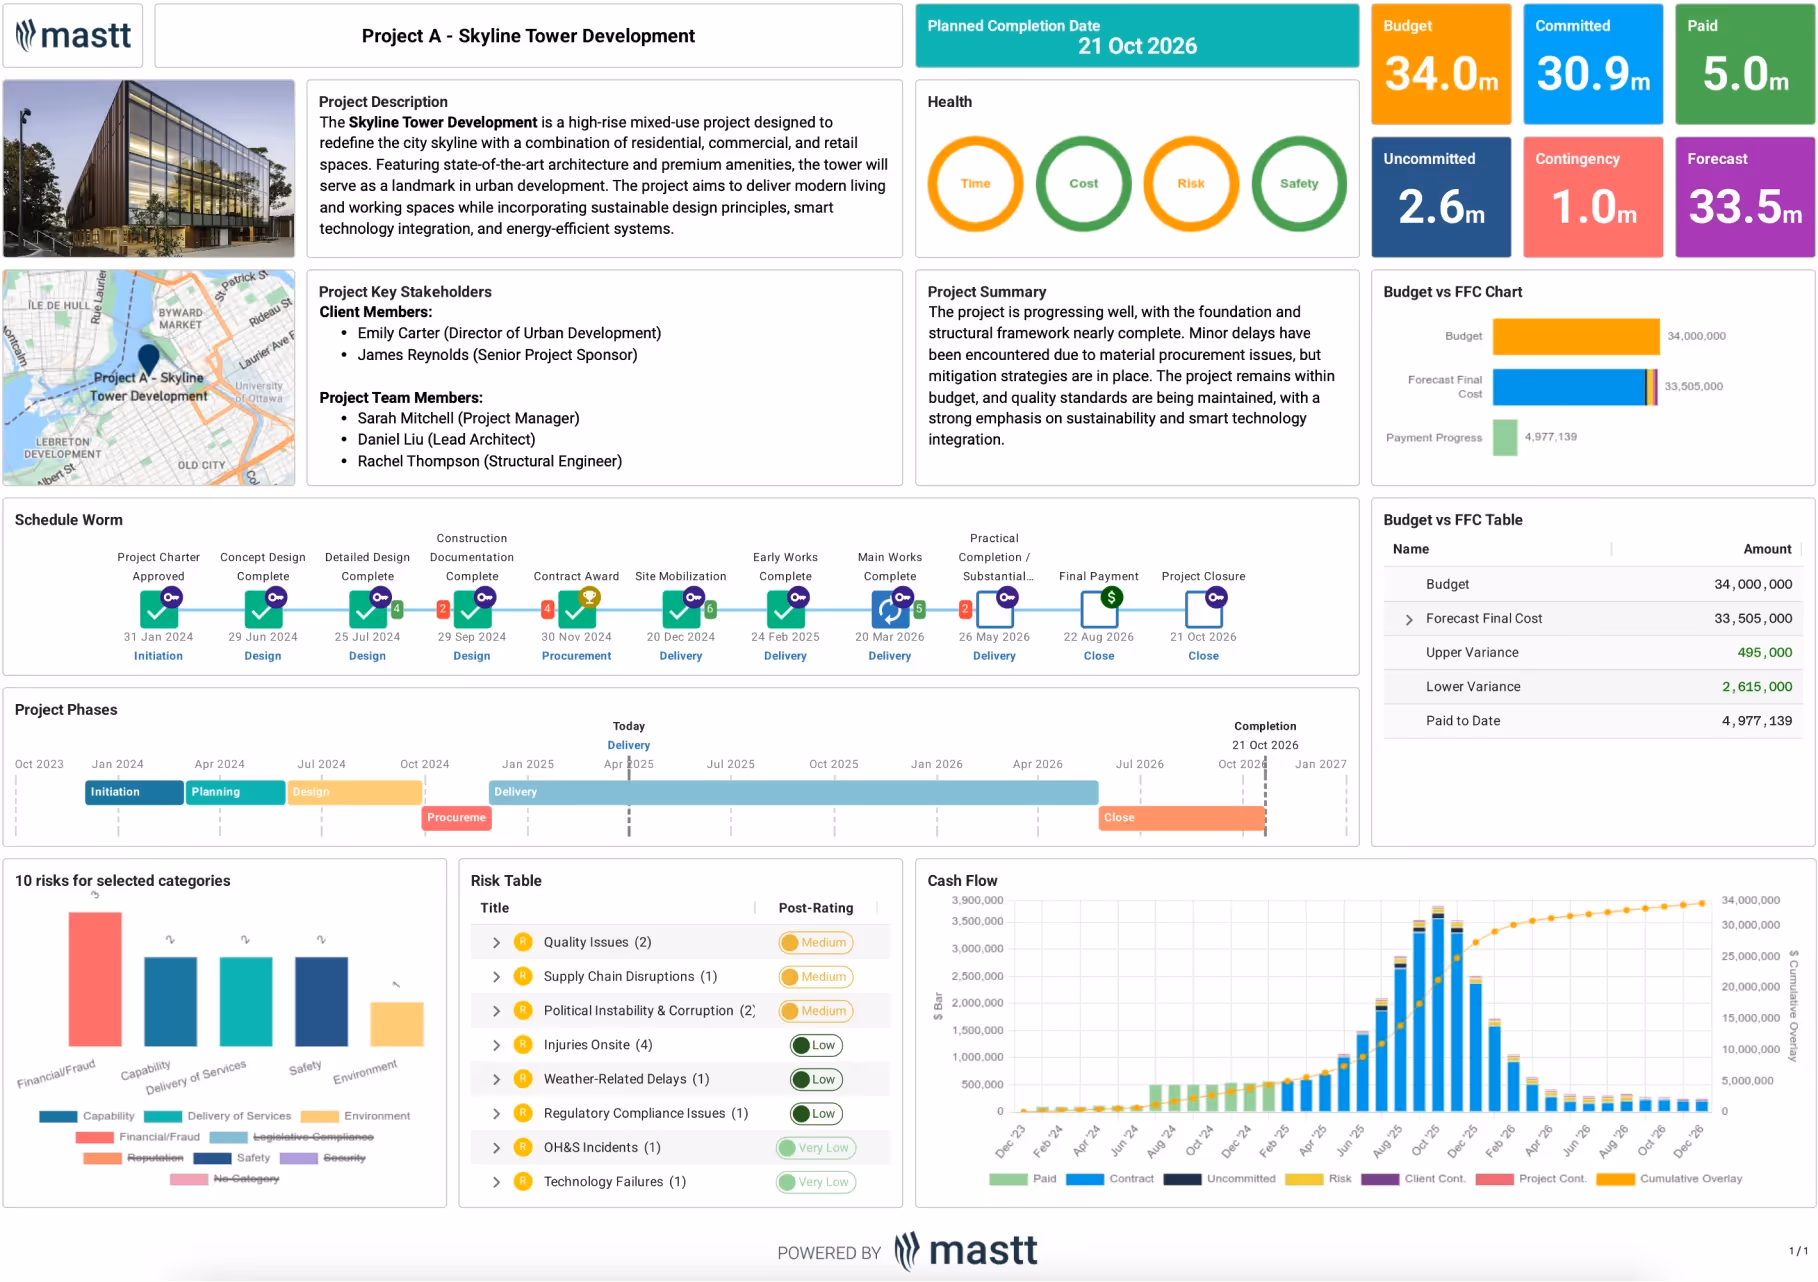
- Project overview panel: Displays project name, description, key stakeholders, client information, location, and timeline summary providing essential context for all viewers.
- Schedule and milestone tracker: Shows major phases like design, procurement, construction, and closeout with planned versus actual completion dates in visual timeline format.
- Budget and financial metrics section: Contains fields for budget, committed costs, paid amounts, uncommitted funds, contingency, and forecast at completion with variance tables and charts.
- Health indicator display: Traffic-light visual system showing performance status across time, cost, risk, and safety categories with color-coded alerts for areas requiring attention.
- Risk management table: Structured log listing current risks by category with fields for description, likelihood rating, impact score, mitigation actions, and post-mitigation status.
- Cash flow visualization: Time-series chart plotting paid costs, committed expenditures, and uncommitted amounts with monthly burn rate trends and cumulative spending overlays.
- Performance metrics dashboard: Earned value calculations including Cost Performance Index (CPI), Schedule Performance Index (SPI), and variance-at-completion projections with threshold indicators.
- Quality and safety panel: Counters tracking punch list items, RFI response times, submittal approvals, safety incidents, and inspection results with status summaries.
- Project summary section: Narrative text field for qualitative status updates, notable achievements, current issues, and mitigation actions providing context to quantitative data.
💡 Pro Tip: Include a variance-at-completion metric that projects total cost and schedule variance at project finish based on current performance trends. This forward-looking indicator helps executives understand final project impact, not just current status.
Why Use a Dashboard for Project Performance Tracking?
Using a dashboard for project performance tracking provides real-time visibility into project health and eliminates manual reporting delays. Dashboards consolidate scattered data from multiple systems into one unified interface. Teams make faster decisions based on current conditions rather than outdated weekly reports.
Project teams gain immediate advantages through dashboards across operational and strategic levels by:
- Instant status visibility: See current performance across cost, schedule, and quality without waiting for someone to compile spreadsheet reports manually.
- Early problem detection: Spot budget overruns and schedule delays when they're still manageable problems instead of discovering them in monthly reports.
- Consistent reporting format: Everyone views the same metrics using identical calculations, eliminating confusion from conflicting spreadsheet versions circulating via email.
- Reduced reporting time: Project managers save 5-10 hours weekly previously spent copying data from multiple systems into status reports.
- Better stakeholder communication: Executives and clients understand project health instantly through visual indicators without reading dense narrative reports.
- Portfolio-level comparison: Standardized metrics enable meaningful performance benchmarking across current projects and historical data for continuous improvement.
- Data-driven decisions: Teams base corrective actions on accurate real-time metrics rather than intuition or anecdotal observations from field visits.
- Automated variance alerts: Receive immediate notifications when metrics exceed thresholds, enabling rapid response before small issues escalate into crises.
Dashboards shift construction project management from reactive to proactive. For example, a portfolio manager overseeing eight projects can spot which sites are trending toward cost overruns immediately. No waiting for individual PMs to escalate problems.
How to Use a Project Performance Dashboard Effectively?
Using a project performance dashboard requires connecting it to live data sources and establishing consistent review rhythms. Start by configuring automatic data feeds from your cost tracking, scheduling, and project management systems so metrics update without manual entry.
Follow these practical steps to maximize dashboard value:
- Set baseline targets during project planning so variance calculations and performance trends have meaningful reference points from day one.
- Conduct daily 5-minute morning reviews scanning for red flags and metrics exceeding thresholds before your first meeting.
- Configure role-based access permissions ensuring executives see summary views while project controls managers access detailed cost code breakdowns.
- Define clear metric ownership assigning each KPI to specific team members responsible for data accuracy and variance investigations.
- Schedule weekly team dashboard sessions to discuss performance trends collaboratively, investigate variances, and align on corrective actions.
- Set threshold-based alerts that automatically notify key personnel when metrics exceed acceptable ranges requiring immediate response.
- Display dashboards during all project meetings on shared screens so they become the single source of truth for status discussions.
- Update forecasts immediately after approved changes to maintain accurate completion projections following change orders or major schedule shifts.
- Export dashboard snapshots at key milestones preserving performance states for permanent project records and lessons learned documentation.
- Validate data quarterly comparing dashboard calculations against source system reports to catch integration errors before they undermine credibility.
💡 Pro Tip: Set up a "dashboard war room" during critical project phases where the live dashboard displays continuously on a large monitor. Field teams and office staff see real-time metrics all day, creating shared accountability and eliminating "I didn't know" excuses when performance slips.
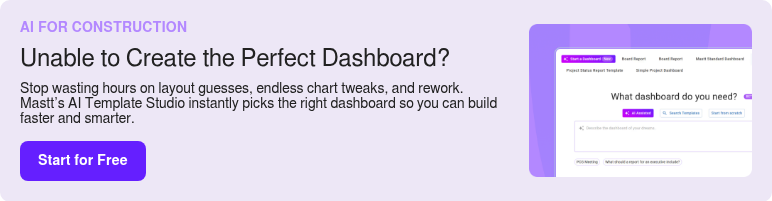
Build Professional Project Performance Dashboards with AI Template Studio
Creating performance dashboards manually drains hours formatting layouts and configuring calculations. Mastt's AI Template Studio eliminates this setup time by instantly generating dashboards tailored to your project type and reporting requirements in seconds.
With AI Template Studio, you can:
🚀 Search pre-built dashboard templates: Explore dozens of construction-ready templates designed for performance tracking, status reporting, and stakeholder updates.
🎯 Match templates to your project: From single builds to multi-project portfolios, AI recommends dashboard structures that align with your delivery method and reporting needs.
⚡ Start with a complete framework: Generate dashboards with sections for budget metrics, schedule tracking, risk indicators, and performance KPIs ready for immediate use.
Instead of spending days building dashboards from scratch, you can have a fully structured performance tracker operational in seconds.
Here's how to use AI Template Studio:
- Access AI Template Studio: From your Mastt dashboard, click Start a Dashboard and select AI Assisted to open the template search tool.
- Describe your needs: Type what you're looking for in the search box, such as "project performance dashboard" or "construction status tracker". AI instantly returns the three most relevant templates.
- Preview and select: Review recommended options with descriptions. Click Preview to see the full dashboard layout and verify it matches your requirements.
- Customize and launch: Click Use This Template and Mastt generates the complete structure. Populate it with your project data and adjust sections as your priorities evolve.
All dashboards include enterprise-grade security protecting sensitive project financial data. Your project information remains completely private and confidential throughout the creation process.
👉 Learn more about dashboard creation in the Mastt Help Center.
Who Should Use a Construction Project Performance Dashboard?
A project performance dashboard is for construction professionals who need to monitor project health across multiple metrics without manually compiling reports. It's designed for anyone managing cost, schedule, and quality who must respond quickly to variances before they escalate into serious problems.
These construction roles gain the most value from performance dashboards:
✅ Project Managers: Monitor project health across cost, schedule, and quality to identify problems requiring immediate intervention.
✅ Project Controls Managers: Track earned value metrics, variance analysis, and forecasts to maintain accurate financial reporting and trend analysis.
✅ Construction Managers and Superintendents: Access field metrics like labor productivity, safety incidents, and quality issues directly from mobile devices.
✅ Portfolio and Program Managers: Compare performance across multiple projects to identify systemic issues and reallocate resources to struggling projects.
✅ Executive Leadership and C-Suite: Review high-level project health indicators during brief check-ins without reading detailed status reports.
✅ Project Owners and Developers: Gain transparency into contractor performance, budget status, and schedule compliance for projects they're funding.
✅ Client-Side Project Managers: Track contractor deliverables, payment application accuracy, and milestone completion supporting informed payment approval decisions.
✅ Contract Administrators and Commercial Managers: Monitor change order impacts, payment applications, and obligations to maintain accurate financial forecasting.
✅ Estimating and Preconstruction Teams: Access actual cost and productivity data from current projects to improve future bid accuracy.
When to Use a Project Performance Dashboard?
Use a project performance dashboard when your project complexity makes manual tracking inefficient or prone to errors. Dashboards become essential once you can't maintain accurate status visibility using simple spreadsheets.
Deploy performance dashboards in these specific situations:
- Project kickoff immediately after contract award: Establish baseline metrics and begin tracking from day one so performance trends are visible from the start.
- Managing projects over $5 million: Cost variance of even 5% represents significant financial exposure requiring constant monitoring and early intervention.
- Multiple active projects: Portfolio managers need consolidated views comparing performance across the entire project portfolio simultaneously.
- Complex schedules with 200+ activities: Critical path tracking and milestone monitoring exceed manual spreadsheet update capabilities.
- Distributed teams working across multiple locations: Teams need shared visibility into unified project status and performance metrics without coordinating multiple reports.
- Monthly executive reporting requirements: Leadership requires consistent, professional project updates without waiting for manual compilation efforts.
- Projects with tight profit margins: Early detection of cost or schedule overruns is critical to maintaining profitability and project viability.
- After project issues emerge: Reactive management revealed previous tracking methods provided insufficient early warning indicators before problems escalated.
- Client transparency requirements: Contracts mandate regular performance reporting with specific metrics and prescribed update frequencies.
- Resource-constrained environments: Project managers handle multiple projects simultaneously and can't spend hours compiling individual status reports.
Start using dashboards before problems occur, not after. By the time you realize manual tracking is failing, you've already lost valuable time detecting and responding to performance issues.
💡 Pro Tip: Implement your project performance dashboard during the planning phase so baseline data populates correctly from the start. Retrofitting dashboards after project start creates data gaps that undermine trend analysis and forecasting accuracy.
Best Practices for Monitoring Project Performance with Dashboards
The single most critical practice is establishing a daily review habit - checking your dashboard every morning before meetings to catch issues while they're still manageable. But effective dashboard monitoring requires more than just looking at the data regularly.
Apply these proven practices to maximize your dashboard's impact on project outcomes:
✅ Establish daily review habits: Check dashboards every morning before meetings to catch problems while recovery options still exist.
✅ Define clear metric ownership: Assign each metric to specific team members who ensure accuracy and investigate variances.
✅ Set threshold-based alerts: Configure automatic notifications when metrics exceed acceptable ranges for immediate issue visibility.
✅ Validate data sources monthly: Verify calculations match source systems to catch integration errors before they undermine credibility.
✅ Customize for audience needs: Create different views for executives, field teams, and owners based on their decision-making requirements.
✅ Document calculation methodologies: Write down how each metric is calculated so teams understand what they're monitoring.
✅ Review trends, not just snapshots: Analyze performance patterns over time since one bad week doesn't indicate systemic failure.
✅ Integrate with project meetings: Display dashboards during progress meetings so teams discuss variances collaboratively.
✅ Update baselines after approved changes: Rebaseline metrics following approved change orders to maintain meaningful variance tracking.
💡 Pro Tip: Apply the "rule of three" - if any metric trends negatively for three consecutive reporting periods, escalate immediately and implement corrective action. Three periods indicate a real problem, not temporary noise.

Common Problems with Manual Performance Dashboard Templates
Manual performance dashboard templates create persistent accuracy and timeliness challenges that undermine project decision-making. Generic templates rarely match specific project needs, forcing awkward workarounds.
These problems consistently plague manual and generic dashboard approaches:
⚠️ Version control chaos: Multiple team members edit different copies, creating conflicting status reports for stakeholders.
⚠️ Broken formula chains: Cell modifications corrupt calculations without visible warnings or error messages.
⚠️ Outdated performance data: Manual updates mean dashboards show last week's metrics when conditions changed days ago.
⚠️ Transcription errors: Copy-paste operations introduce mistakes that misrepresent status and drive incorrect decisions.
⚠️ Wrong metrics for your project: Generic templates include irrelevant KPIs while missing critical metrics for your delivery method.
⚠️ Inconsistent formatting across projects: Portfolio comparison becomes impossible without extensive cleanup and standardization.
⚠️ Limited drill-down capability: Static spreadsheets can't link summary numbers to transaction details for investigation.
⚠️ Massive time consumption: Teams spend 5-10 hours weekly compiling metrics instead of analyzing trends.
⚠️ No audit trail: Can't track how metrics evolved or understand what information supported past decisions.
⚠️ Poor mobile access: Field teams can't view or update dashboards from job sites without laptops.
Manual dashboards report performance 1-2 weeks behind reality due to compilation lag. By the time issues appear, corrective actions cost 3-5 times more than early intervention would have required.
Teams waste valuable hours debating data accuracy instead of solving project problems. "That number can't be right" becomes common meeting refrain. Trust in reported metrics erodes. Eventually teams stop using dashboards altogether and revert to anecdotal status updates.
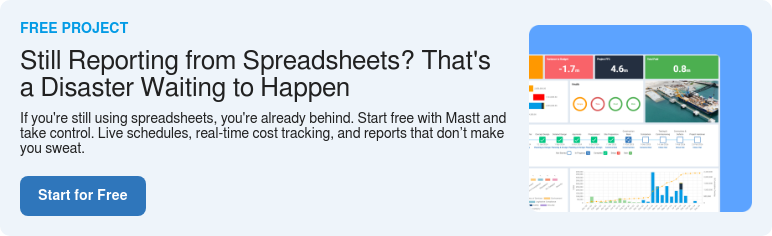
Transform Project Performance Tracking with Mastt
Mastt eliminates manual dashboard compilation by connecting your cost tracking, scheduling, and project data into unified, real-time performance dashboards. The platform automatically updates metrics as transactions occur, giving you instant visibility without spreadsheet chaos.
Mastt's AI Template Studio generates custom dashboards matching your project requirements in seconds, while role-based access ensures stakeholders see relevant information without data overload. Teams report 70% reduction in reporting time and catch budget overruns early when corrective action costs remain manageable.
👉 Stop wasting hours on manual reports. Start tracking project performance in real-time with Mastt and transform how your team monitors project health.

Written by
Jefbeck Eje
Jefbeck is an SEO Specialist at Mastt who creates optimized content for the construction project management industry. Focused on delivering accurate and actionable insights, Jef combines SEO expertise with industry knowledge to enhance visibility, build authority, and drive engagement. His work ensures Mastt remains a trusted resource for construction professionals seeking reliable information.

Use this FREE project performance dashboard template to monitor project health, track KPIs, and make data-driven decisions across your portfolio. Transform scattered metrics into unified visibility for better project outcomes.

Top Performers Don’t Guess. They Deliver.
Cut the stress of showing up unprepared
Start for FreeTrusted by the bold, the brave, and the brilliant to deliver the future