
What Is a Construction Project Cash Flow Spreadsheet?
A construction project cash flow spreadsheet maps, period by period, when cash enters a project and when it leaves. You work from a simple, ready-made Excel or Google Sheets layout instead of building the columns and formulas yourself. Receipts, payments and the running balance sit in one time-phased view.
It is also known as a project cash flow template, a cash flow projection, or a cash flow table (also written as cashflow). It is a forward-looking planning tool, not an accounting cash flow statement.
You set inflows, like funding drawdowns, progress payments and milestone payments, against outflows such as certified payments, materials and fees. Across the program, the periods where the project runs short become visible while there is still time to act on them. For the fundamentals and how to improve it, see our guide to construction cash flow.
What's Included in a Construction Cash Flow Template
A construction cash flow template includes a time-phased grid of inflows, outflows, and the running cash balance. It sets certified revenue against committed cost: the cash you can draw on, not booked profit. Each line below builds toward the cumulative position, the figure that shows your real cash availability:
- Opening and closing balance for each period, so the running cash position is always explicit.
- Inflows: funding drawdowns (equity, debt, grant or board-approved budget releases), progress payments (called progress claims in Australia and the UK), milestone payments, and retainage due for release.
- Outflows: payments certified against contractor payment applications, consultant fees, materials and long-lead procurement, plant, insurance, and authority fees.
- Retainage (retention in Australia and the UK) held against each payment, the usual 5 to 10 percent. It stays out of available funds until release at substantial completion (practical completion in Australia and the UK).
- Change orders (called variations in Australia and the UK), which move both committed cost and the payment profile.
- Contingency drawdown for risk events not yet realized.
- Net and cumulative cash position, the figure that signals when the project moves into deficit.
💡 Pro Tip: Tie the schedule back to a schedule of values or a draw schedule so each payment aligns with work in place. Plot the cumulative line as a cash flow chart (the project cash flow diagram, or S-curve). It should mirror your planned S-curve.
How to Use a Construction Cash Flow Forecast Template in Excel
To use a construction cash flow forecast template in Excel, sequence the inflows, then the committed outflows, then read the cumulative position. The order matters more than formula complexity. Work through six steps:
- Set the periods. Match the columns to your certification cycle, monthly on most capital projects.
- Phase the inflows. Enter funding drawdowns and payment applications on the dates cash realistically clears, not the contractual dates. If a client or funder settles on a 45-day cycle, model 45 days.
- Enter committed outflows. Place each contract's payments and expenses in the period they come due, allowing for the lag between certification and disbursement.
- Apply retainage. Withhold it from each payment and hold it until the contractual release date.
- Read the cumulative row. Any negative period is a funding gap; close it with a drawdown, bridge financing, or a reprofiled payment.
- Sense-check the curve. Plot the cumulative line against the planned S-curve; a flat spot usually means missing commitments.
Ten minutes after each certification cycle keeps the profile honest. A forecast updated quarterly is a record, not a tool.
Why Forecasting Project Cash Flow Matters
Cash flow failure can close a construction company even while margins look healthy, and the industry's payment terms are the reason. A project can forecast a healthy margin and still hit a liquidity wall.
Profit is a position you reach at closeout; cash flow is a constraint you manage every billing cycle. Front-loaded costs, slow certifications, retainage and late funding draws pull the two apart. Managing that gap is the core of construction forecasting on a capital project.
The same sheet covers cash flow planning, ongoing tracking, and period-end analysis. A well-run forecast lets you:
- Surface a liquidity shortfall several periods ahead, while a drawdown or facility can still be arranged.
- Sequence certified payments against confirmed funding, so commitments stay inside available funds.
- Evidence a funding or facility request with a dated profile of peak exposure.
- Stress-test a slow-paying client or a delayed drawdown before it cascades through the program.
💡 Pro Tip: model receivables on a 30-day lag even when the contract specifies 15. Payment rarely lands on the contractual date in construction. A 45 to 60 day assumption keeps the profile defensible with a board or a lender.
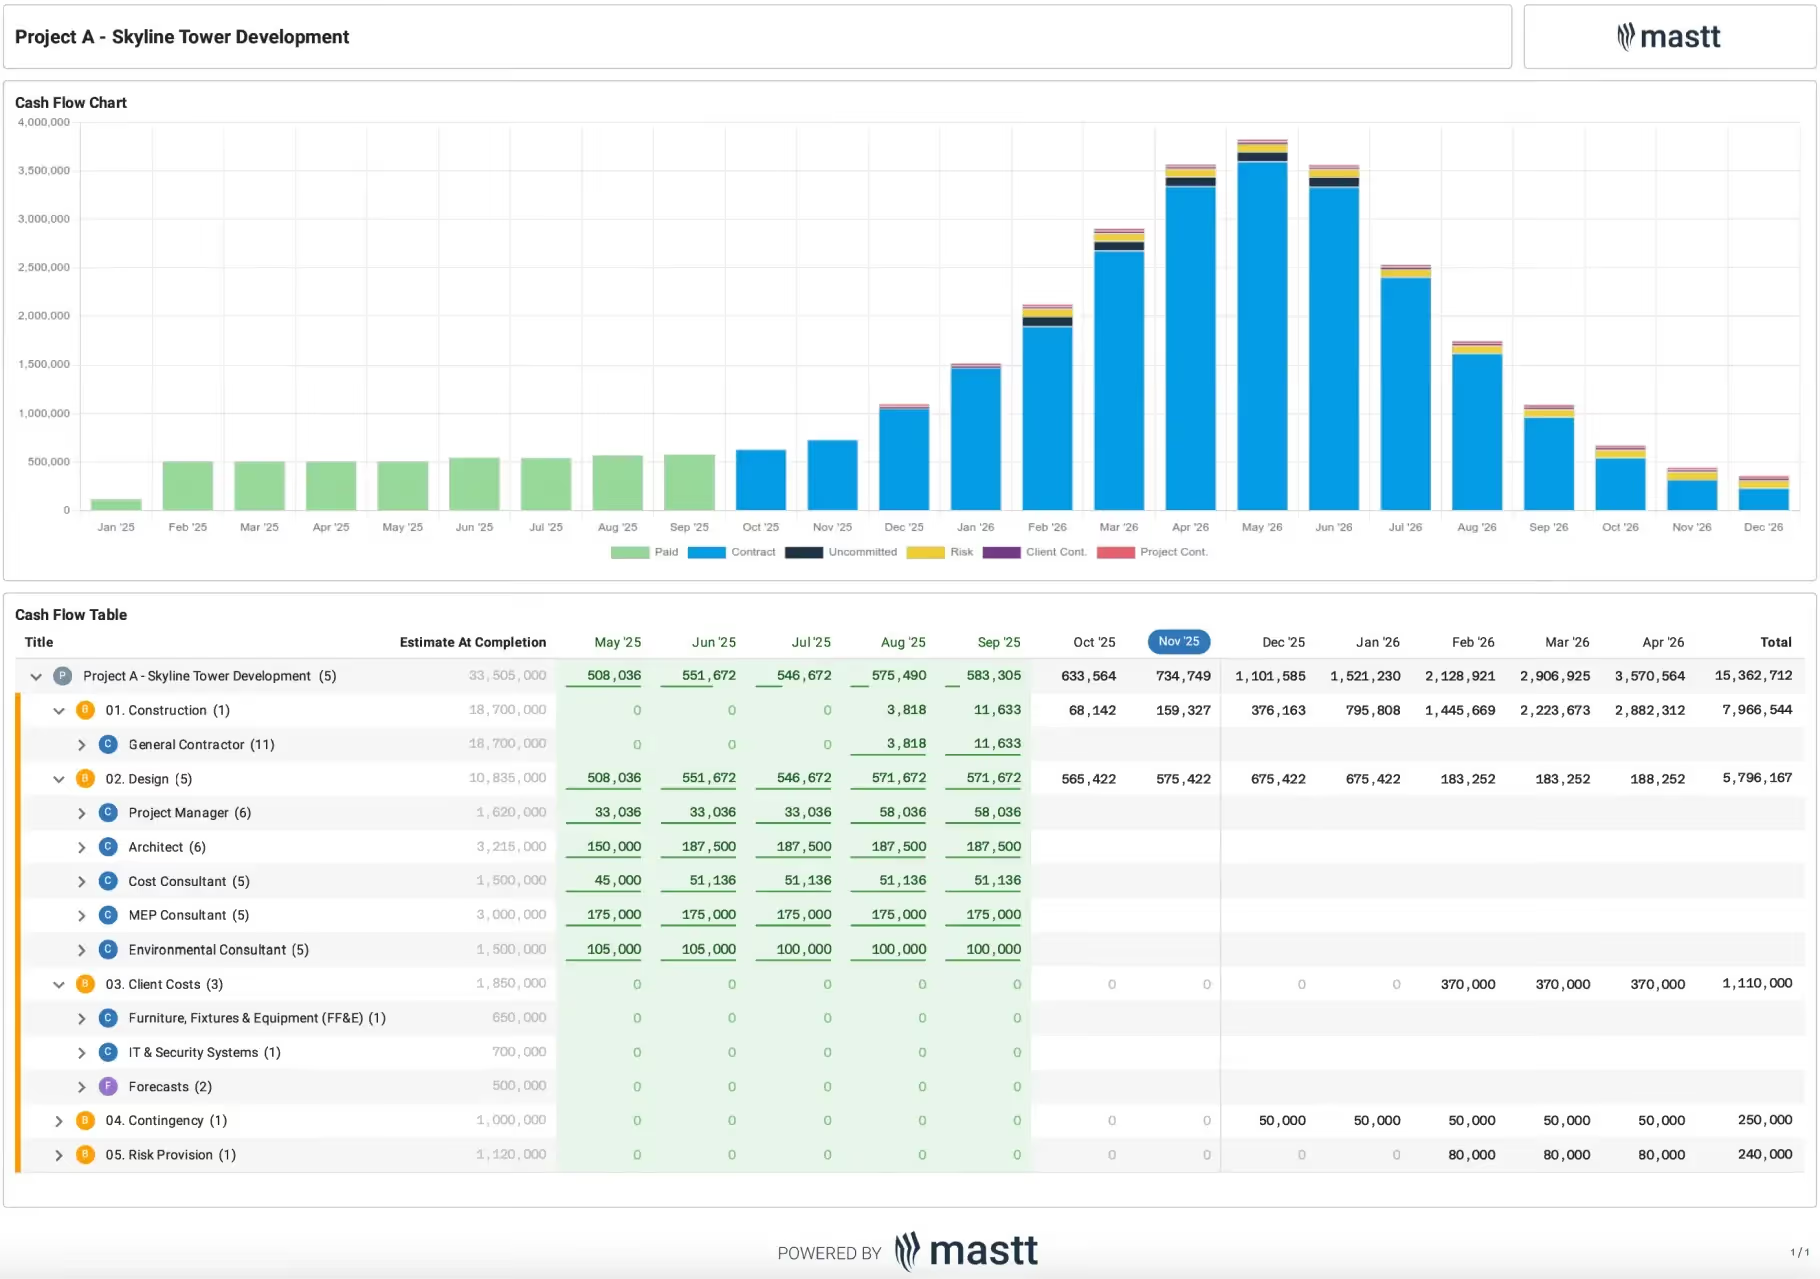
Construction Cash Flow Forecast Example
Here is a good example of a construction cash flow forecast, taken from a capital project in Mastt.
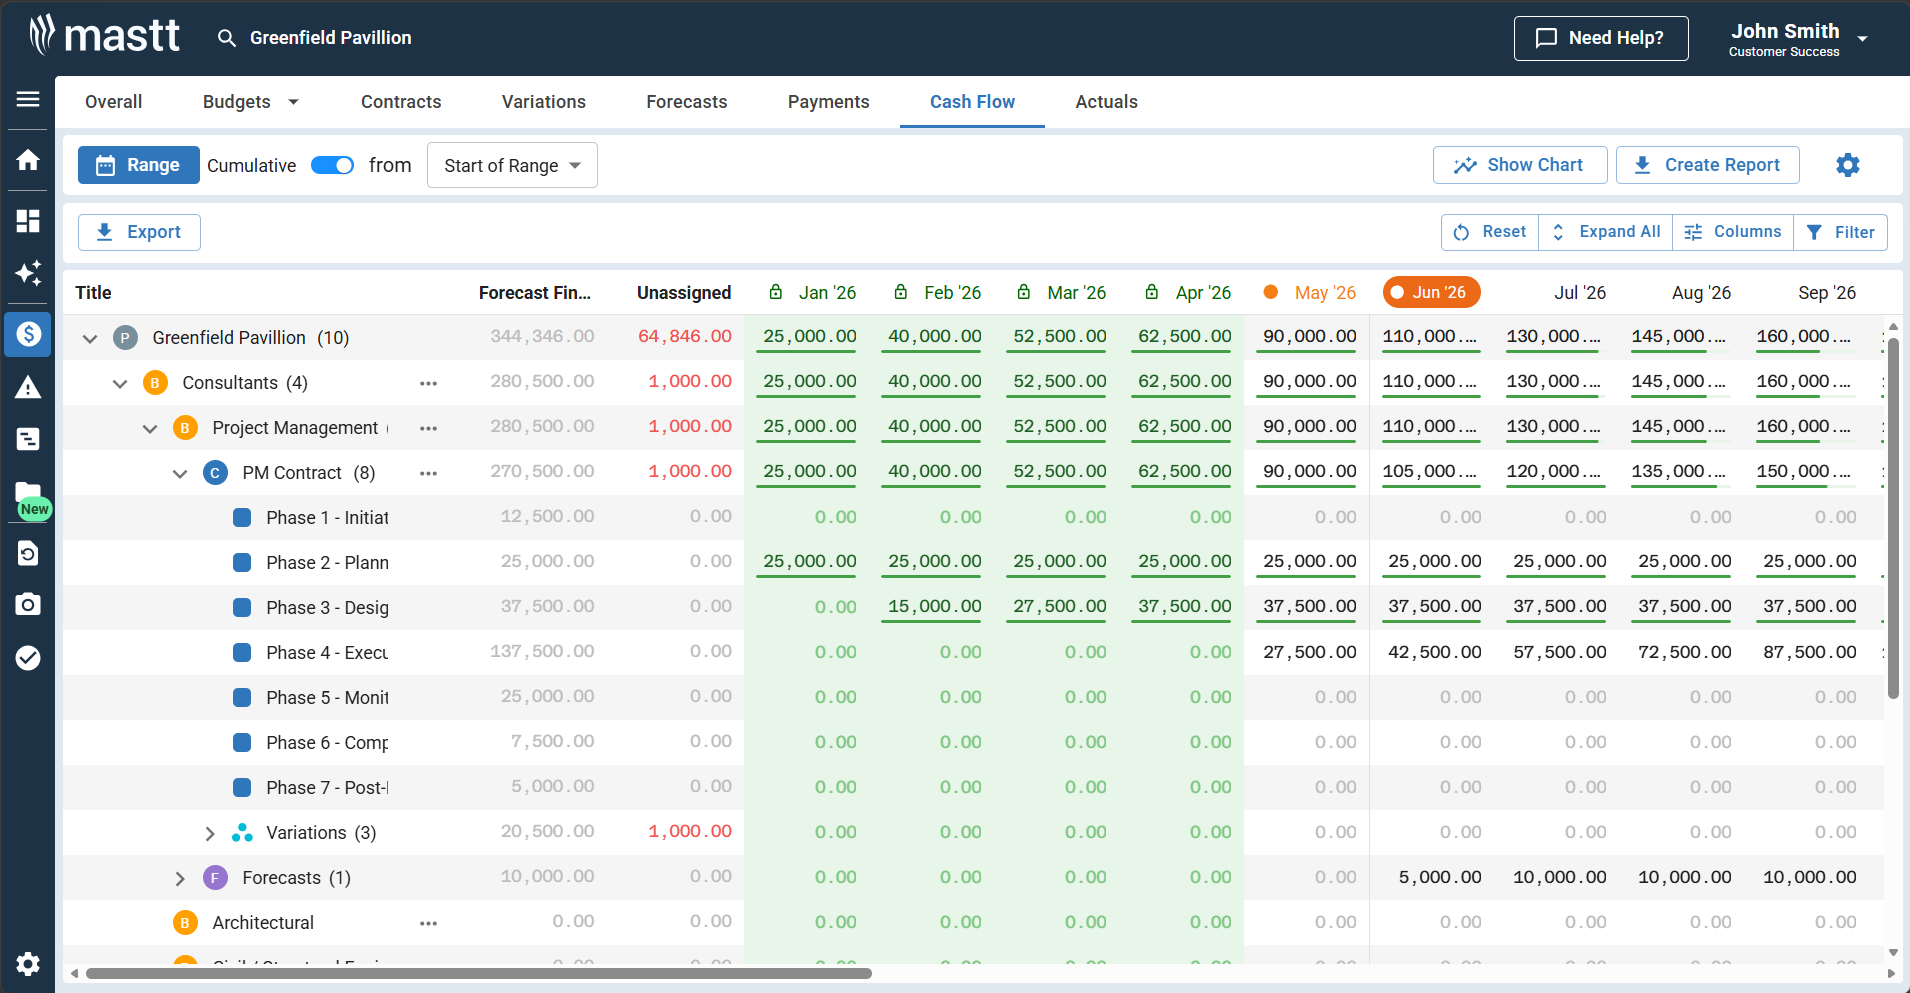
In this example, consultant and project management contract costs are phased month by month. The cumulative position steps up as each phase begins: 25,000 by January, 90,000 by May, 160,000 by September. Cost not yet phased sits in the unassigned column until it is spread, so nothing drops out of the forecast.
Who Uses a Construction Cash Flow Template
A construction cash flow template is used by the people accountable for the capital, not the trades doing the work. On the owner and client side it is essential for:
- Project owners and developers: align funding drawdowns with the payment profile, so board-approved capital is available as each certification falls due.
- Client-side project managers and owner's representatives: confirm that certified payments match progress and flag drawdown or approval delays early.
- Capital program and portfolio managers: compare cash positions across multiple projects from one consistent view.
- PMOs, project controls and finance teams: forecast exposure, plan equity or debt draws, and report cash position to the board, treasury or funder.
Delivery-side teams use the same forecast. General contractors and cost managers model committed cost, certified revenue and retainage release to manage working capital. The funding and certification view, though, is where owners and their advisors operate.
When to Use a Project Cash Flow Template
Use a project cash flow template whenever payment timing creates liquidity risk. Build or refresh it at these points:
- Before works start, when mobilization and early procurement land ahead of the first drawdown.
- At each certification cycle, to reforecast as payments are certified and funding is drawn down.
- The moment a funder or client moves a payment date, since it shifts the entire downstream profile.
- Before a major commitment, to confirm capital is in place ahead of a large contract or change order.
- Approaching substantial completion, to time the retainage release that restores headroom.
💡 Pro Tip: save a dated copy at each reforecast. When a funder questions the profile, the sequence of dated forecasts shows when the gap emerged and what changed.
Common Cash Flow Template Problems and How to Fix Them
Most Excel cash flow forecasts fail in the same seven ways, and each failure has a known fix. Check your sheet against this list before the next reporting cycle:
Each fix is manual effort that grows with the contract count. The structural answer is connecting the forecast to live cost data.
Manage Construction Cash Flow in Mastt
For project owners and client-side teams, Mastt's Cost Module builds the cash flow from live budgets, contracts and certified payments. The software keeps monitoring effortless: the forecast reconciles to the cost report instead of drifting from it.
Build your cash flow in Mastt to:
📊 See the whole position in one view: chart and table, target and baseline lines, and cumulative balances.
✏️ Add budgets, contracts, forecasts or payments with the + Add button, so the forecast stays complete.
🎯 Customize the view: toggle the chart, switch cumulative on, adjust date ranges, and filter columns.
📥 Export the current view or all data, and create PDF cash flow reports for stakeholders.
Here's how to get started:
- Set up the budget: add the project budget with + Add then Budget, including approved adjustments and forecasts.
- Open Cash Flow inside the Cost Module.
- Add contracts and payment schedules: create contracts with + Add then Contract and link them to budget lines. Enter payment schedules, payments and change orders.
- Set a target and baseline: click Action on the cash flow row and choose Edit Target or Edit Baseline Cash Flow. Enter values per period.
- Review and close periods: set the date range (calendar or fiscal year), then close off each period once its payments are recorded. Closed periods lock the data for reporting.
- Export and share: export the current view or all data, or create a PDF cash flow report.
💡 Pro Tip: connect the payment schedule first. Once contracts and certifications are in, the cumulative position maintains itself and the monthly rebuild disappears.
Related templates: S-curve Excel template, draw schedule template, and payment schedule template.

Written by
Jackson Row
Jackson Row is the Growth & North American Market Lead at Mastt. With a background in risk modeling, cost forecasting, and integrated project delivery, he helps capital project owners work smarter and faster. Jackson’s work supports better tools, better data, and better outcomes across the construction industry.

Use this construction project cash flow spreadsheet to forecast payment timing and prevent liquidity shortages. Track expected receipts from clients against scheduled payments to subcontractors, identifying funding gaps before they delay payroll or stop work.

Top Performers Don’t Guess. They Deliver.
Cut the stress of showing up unprepared
Start for FreeTrusted by the bold, the brave, and the brilliant to deliver the future