


What is a Multiple Project Tracker?
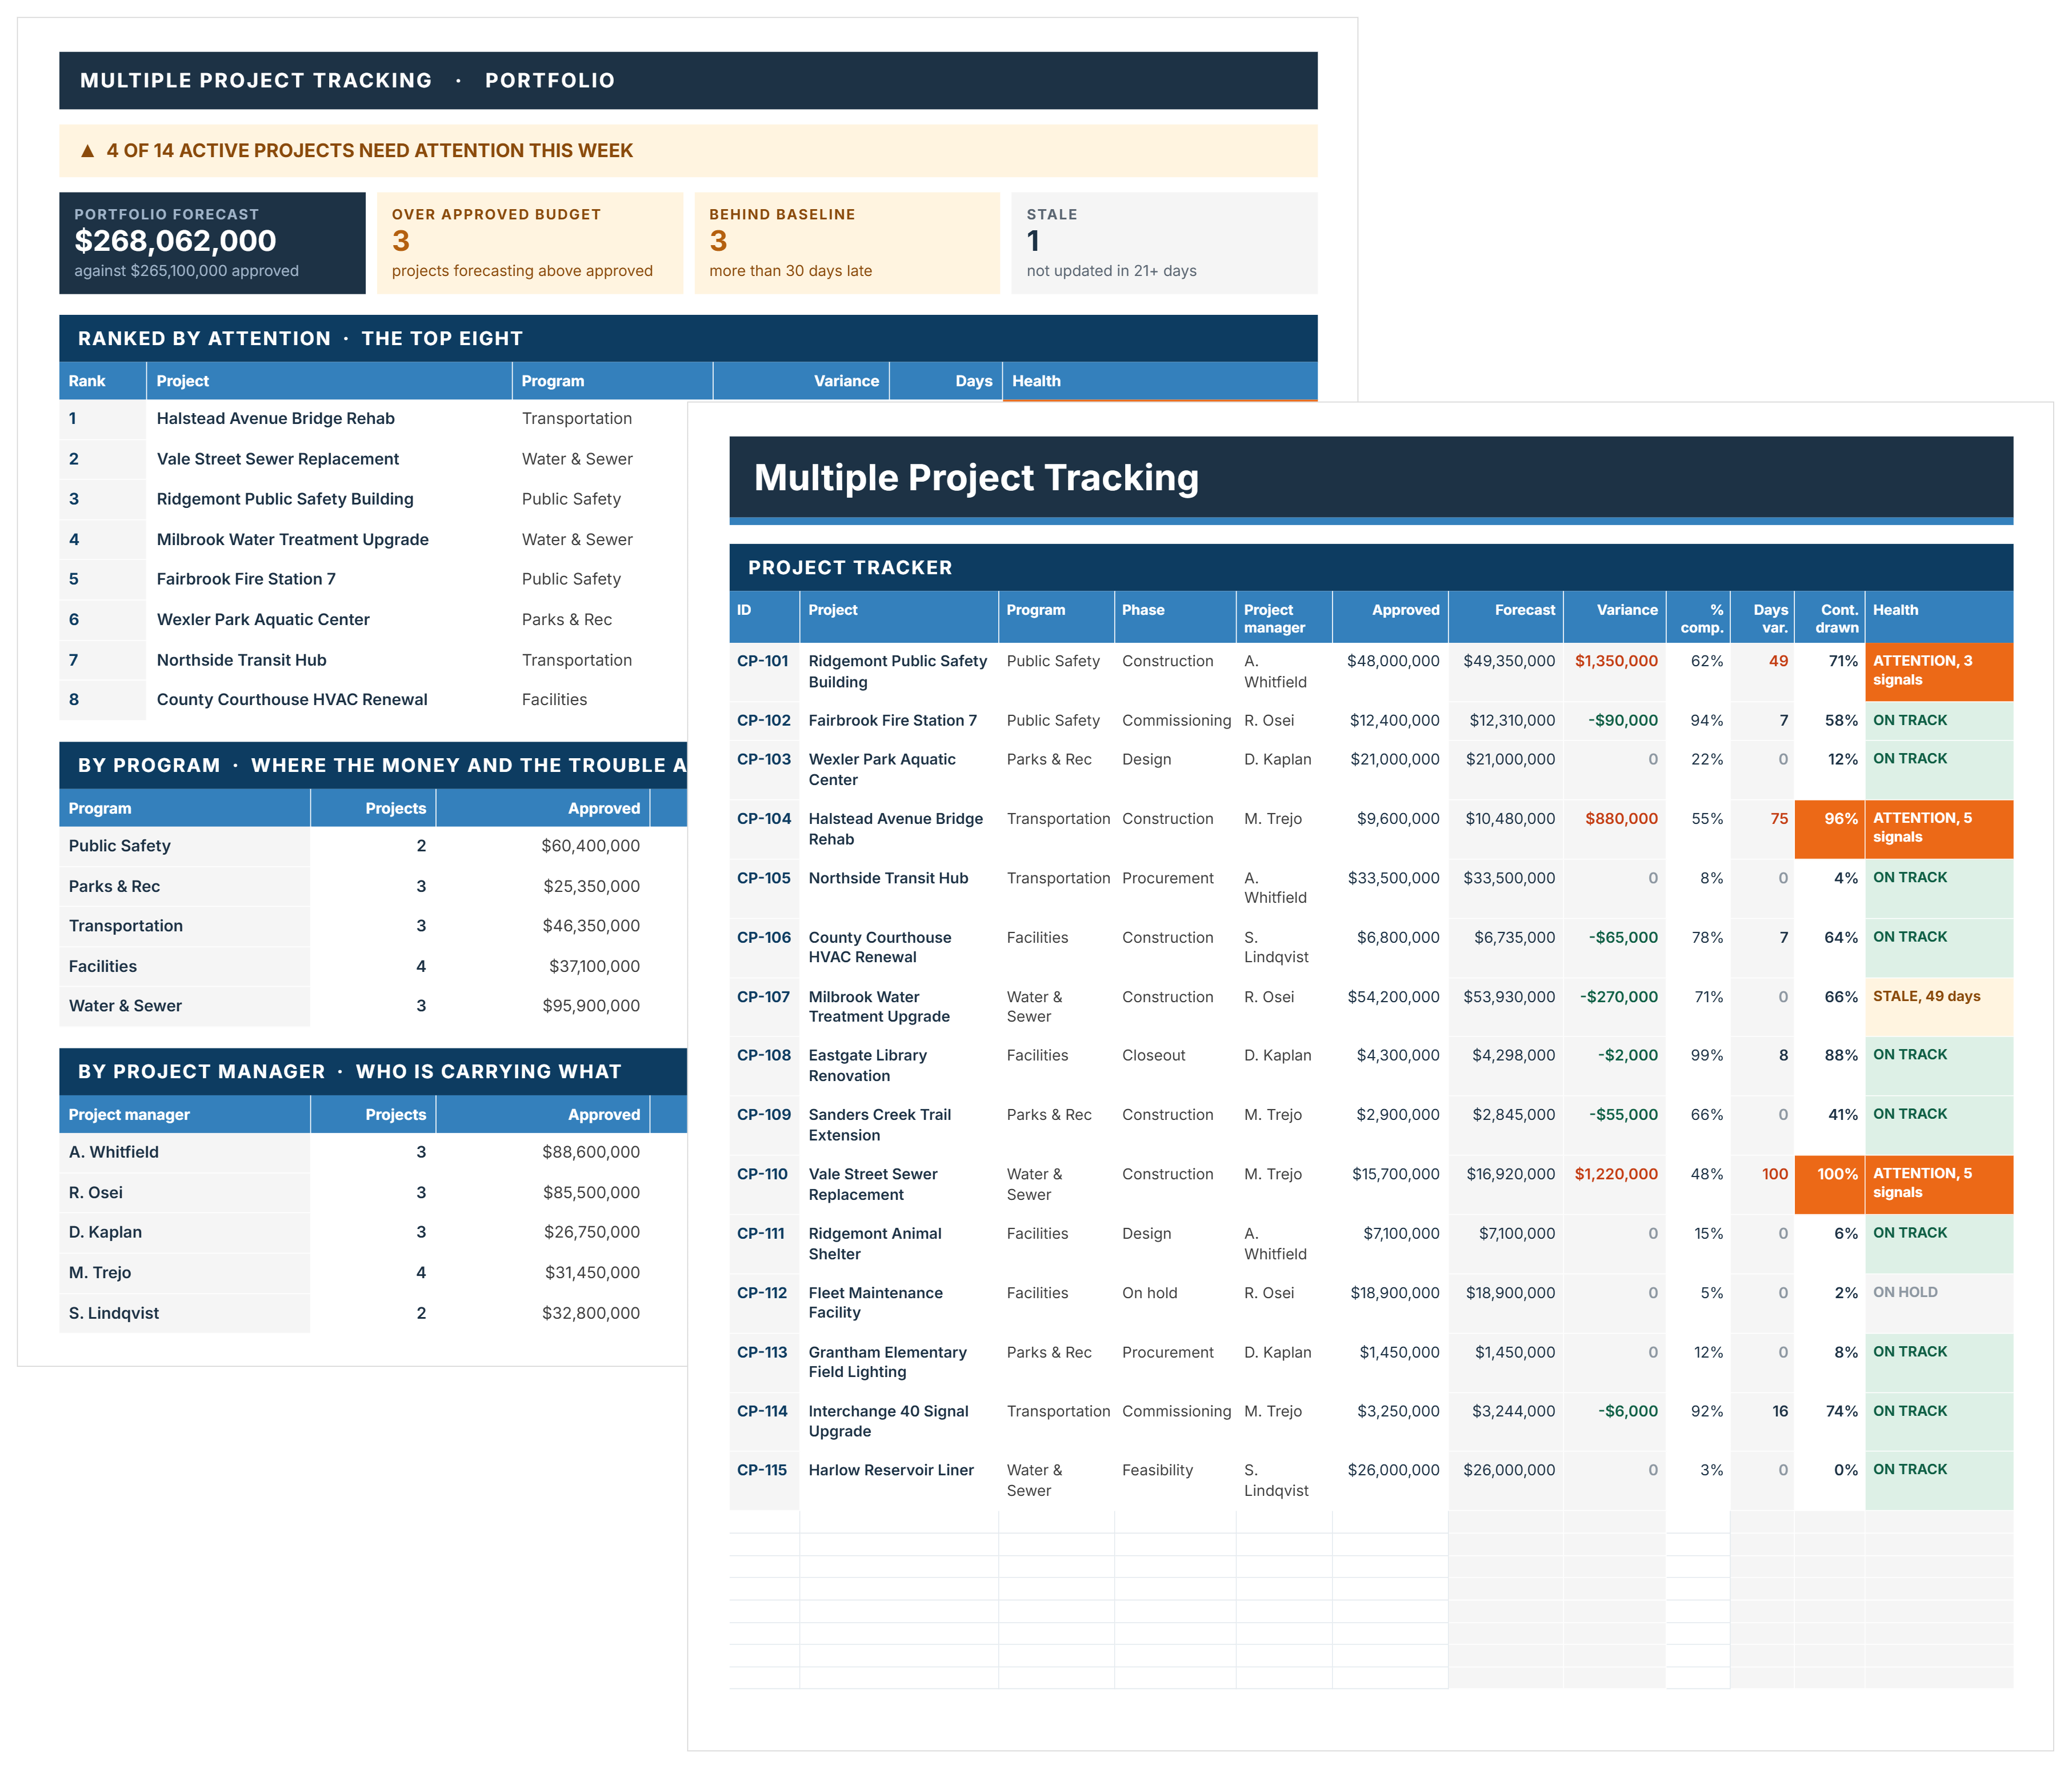
A multiple project tracker is a single sheet holding one row per project, with the cost, schedule and status of each in the same columns so they can be compared. It answers one question: which project needs attention now.
Also called a multi project tracker or a multiple project tracking template. It is not a schedule, because it holds no tasks or dependencies, and it is not a project list, because a list records what exists while a tracker records how each one is doing.
Multiple Project Tracking Template Example
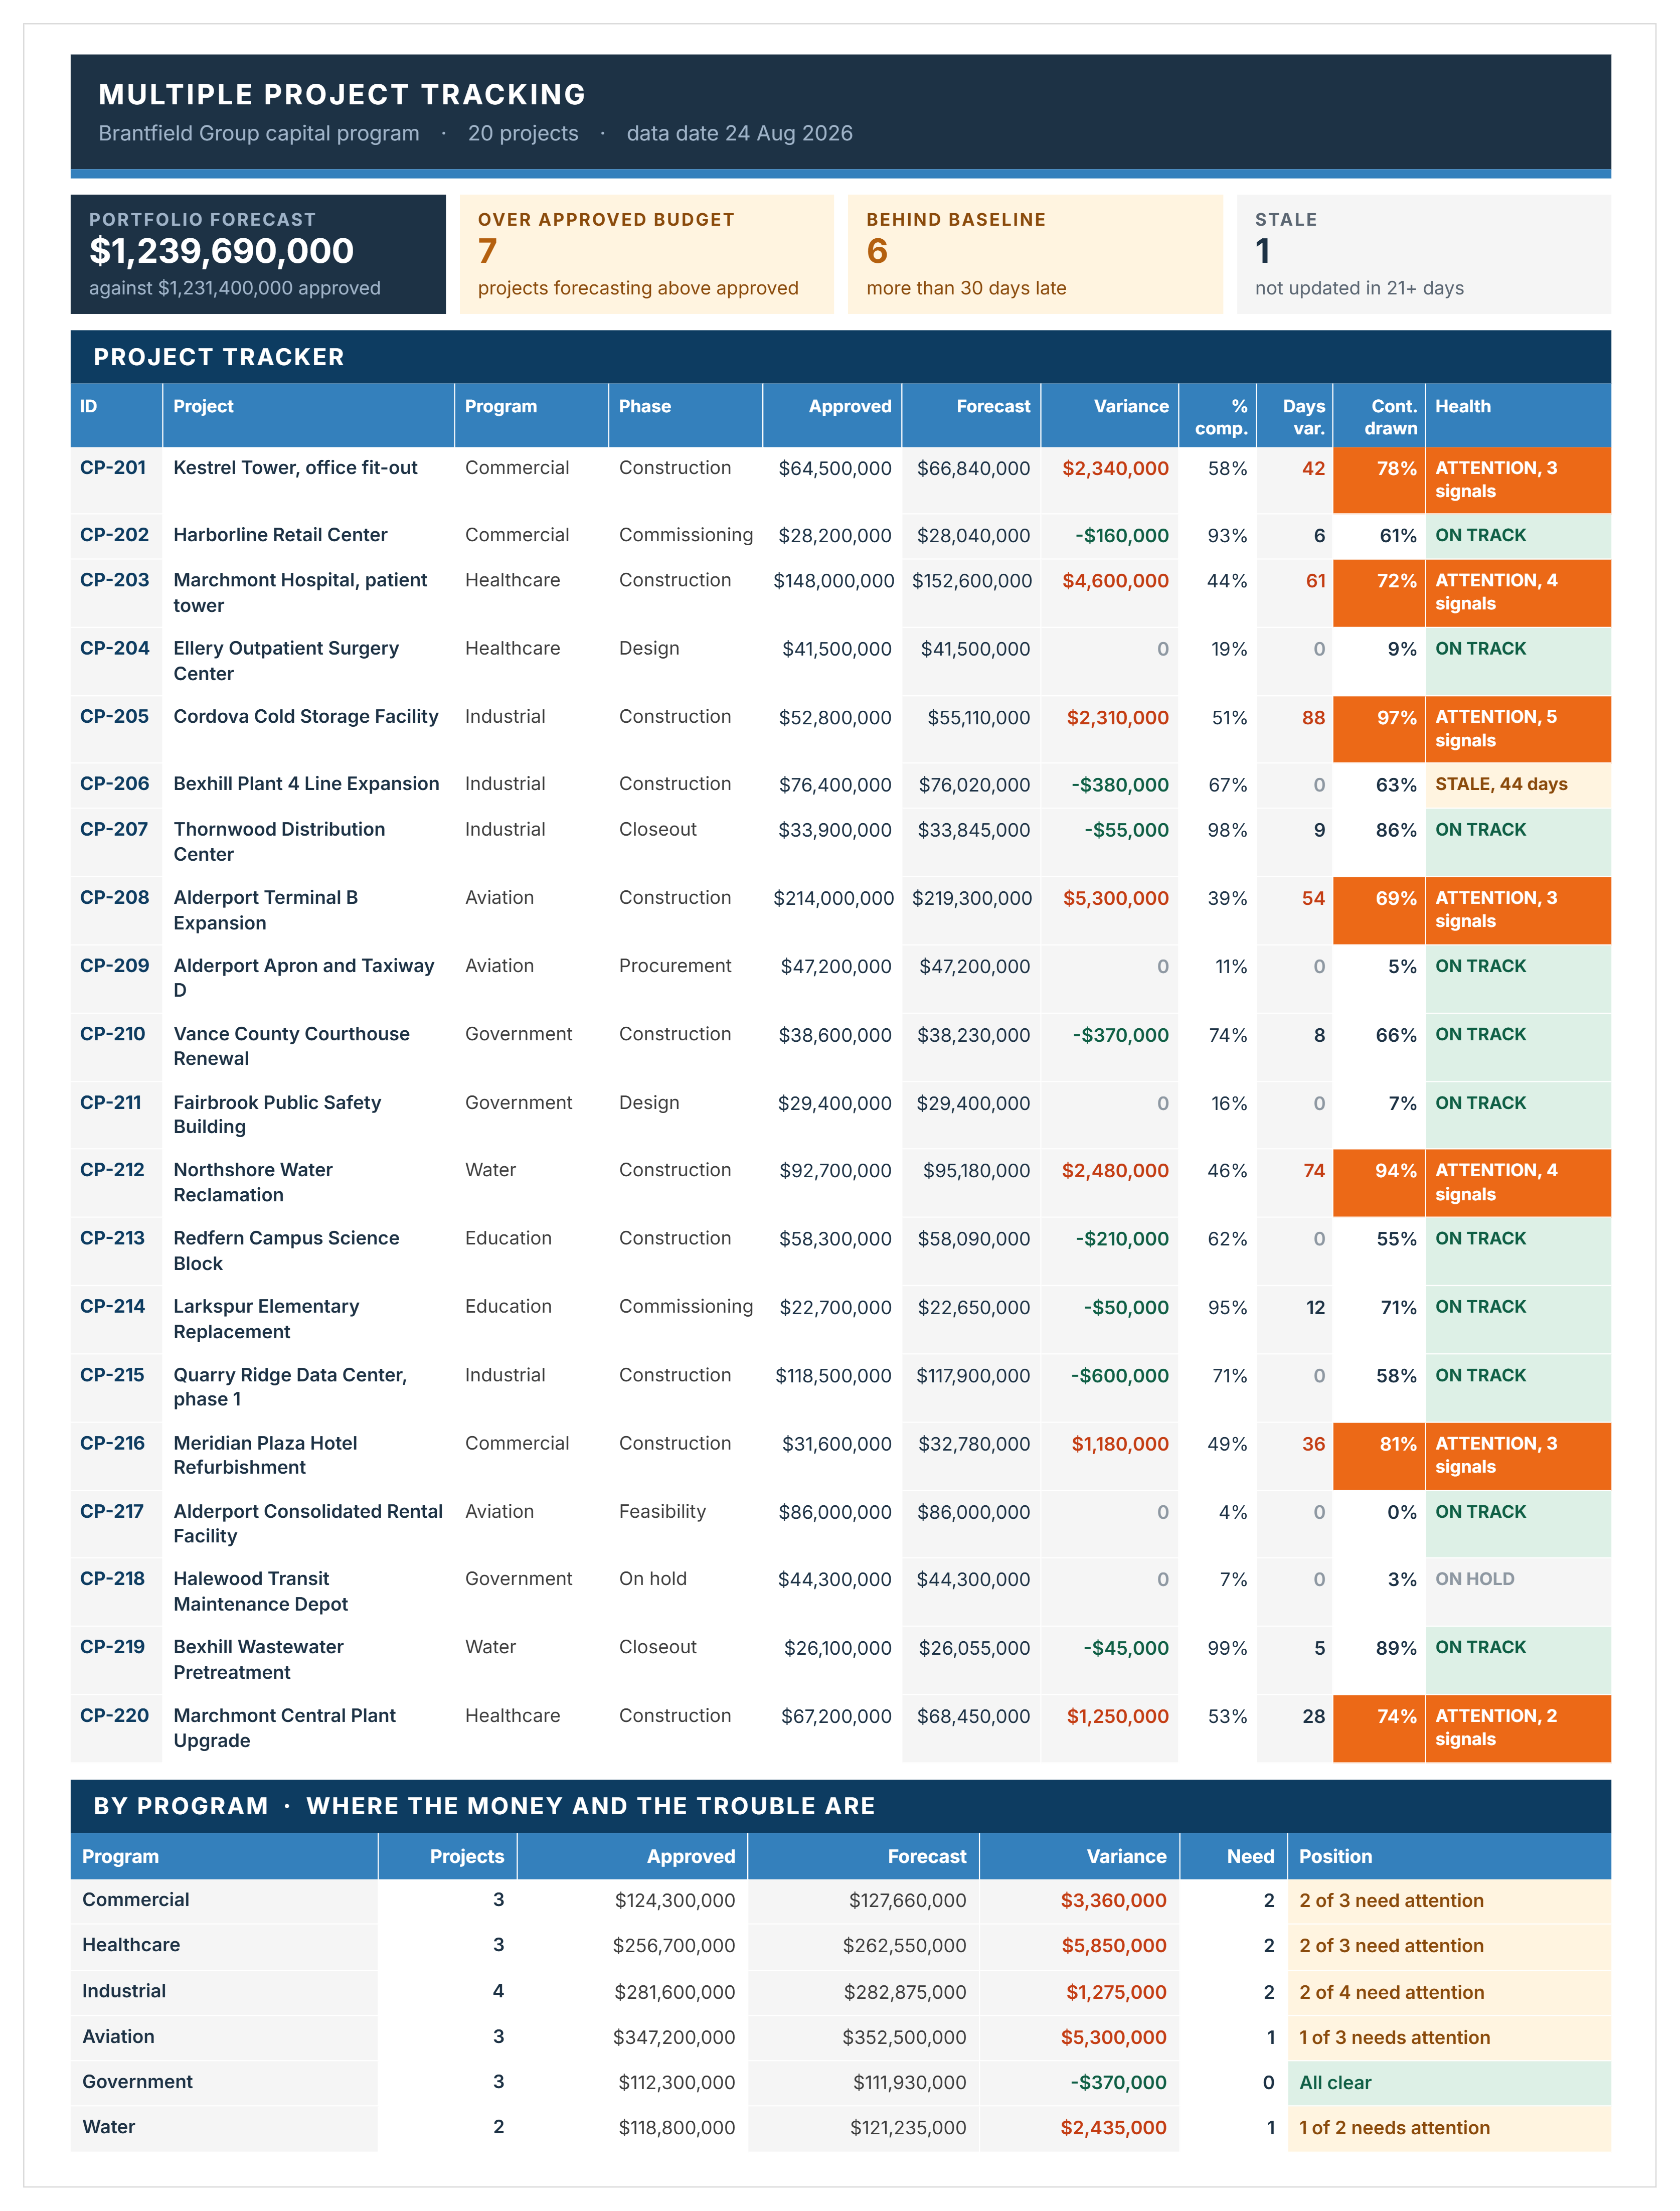
Here's a good example of a multiple project tracker, covering twenty capital projects worth $1.24 billion.
What to Track Across Multiple Projects
Track four things on every project: money against approved budget, schedule against baseline, how much contingency has been drawn, and when the row was last updated.
Contingency drawn against percent complete is the column most trackers leave out, and it moves first. A forecast is a judgment and judgments lag; contingency drawn is arithmetic.
How to Track Multiple Projects in Excel Using This Template
Update the whole portfolio on one day each month. A tracker where half the rows are current and half are six weeks old is worse than none, because the comparison between projects stops working.
- Set the six thresholds on the Reference sheet before entering anything, since every row scores against them.
- Edit the dropdown sources for phase, program and project manager to match your organization.
- Replace the fifteen example projects, typing over the white cells only.
- Insert new rows inside the existing block rather than below it, so the formulas and the ranking follow.
- Enter approved budget and current forecast from the same source you report from, not from two different ones.
- Enter percent complete on the same basis for every project, since mixing cost-based and time-based percentages makes the contingency test meaningless.
- Enter contingency drawn as a percentage of the contingency allowed, not of the budget.
- Set the phase to On hold for any paused project, which keeps its row and its budget but removes it from the ranking.
- Update every row on the same day each month, then read the ranking rather than the individual rows.
- Revisit the thresholds annually, since a 2% cost tolerance suits some portfolios and not others.
Fifteen to twenty projects is where a spreadsheet works. Past that, the monthly update becomes a job in itself and the data is out of date before the meeting. Capital program management software holds the same figures live, so the ranking reflects today rather than the day someone last typed.
How This Template Scores and Ranks Project Health
Every project is scored against six objective tests. Its health is the count of tests it fails, so nobody has to argue about whose project is worse.
Change any threshold and every row re-scores. Staleness is a failed test on purpose. A project reporting on track that nobody has touched in six weeks is not on track, it is unknown, and most trackers show it green. Projects on hold keep their row and drop out of the ranking.
Related Articles and Templates
Explore these resources for multiple project tracking, scheduling, portfolio oversight, and program management:
- Multiple Project Management: Guide for Project Managers
- Construction Project Tracking Template
- Multiple Project Schedule Template Excel
- Construction Project List Template
- Project Portfolio Management Template
- Project Portfolio Dashboard
- How to Effectively Manage Multiple Construction Projects as a Program
.avif)
Written by
Doug Vincent
Doug Vincent is the co-founder and CEO of Mastt, the AI capital-project management platform used by governments, Fortune 500 companies, and consultancies across APAC, North America, and MENA. Before founding Mastt in 2019, he spent a decade at RPS delivering more than $2 billion in capital works, including the $2.1B Defence Navy Infrastructure program, and holds a CPSPM certification with the AIPM. He contributes content and speaks on AI in capital project delivery at Mastt.

See which of your projects needs attention this week, without arguing about it. This free multiple project tracking template scores every row against six tests and ranks them by how many they fail.

Top Performers Don’t Guess. They Deliver.
Cut the stress of showing up unprepared
Start for FreeTrusted by the bold, the brave, and the brilliant to deliver the future