
Add fast text updates to your dashboards and reports for greater context.

Add context to dashboards and reports without slowing your team down. Place commentary, descriptions, and dynamic text alongside project visuals, then export clear, presentation-ready reports faster.
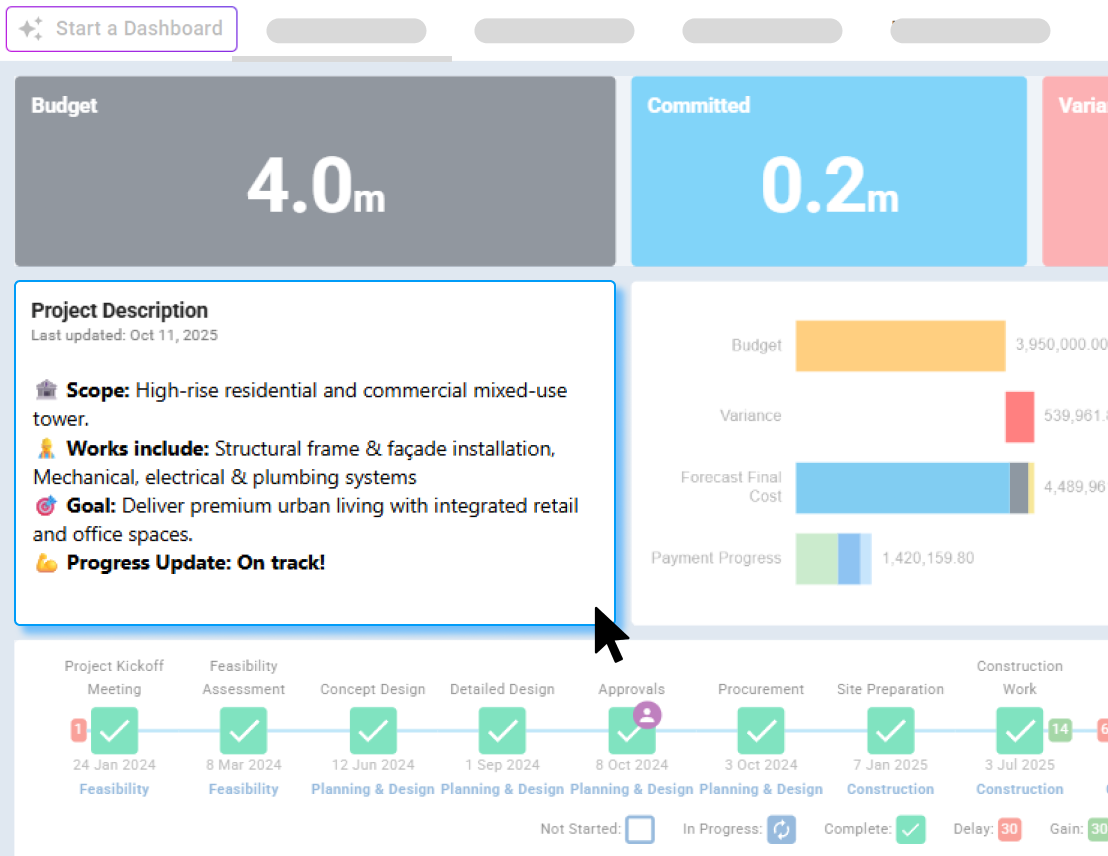
Add text directly into dashboards so stakeholders get the context behind cost, risk, and schedule data in the same view. Use titles, descriptions, annotations, and narrative updates to make reporting easier to read and faster to act on.
📝 Add standard or dynamic text tiles from the Tile Library.
📊 Place commentary beside charts, tables, and project metrics.
👥 Support stakeholder reporting with written context inside the dashboard itself.
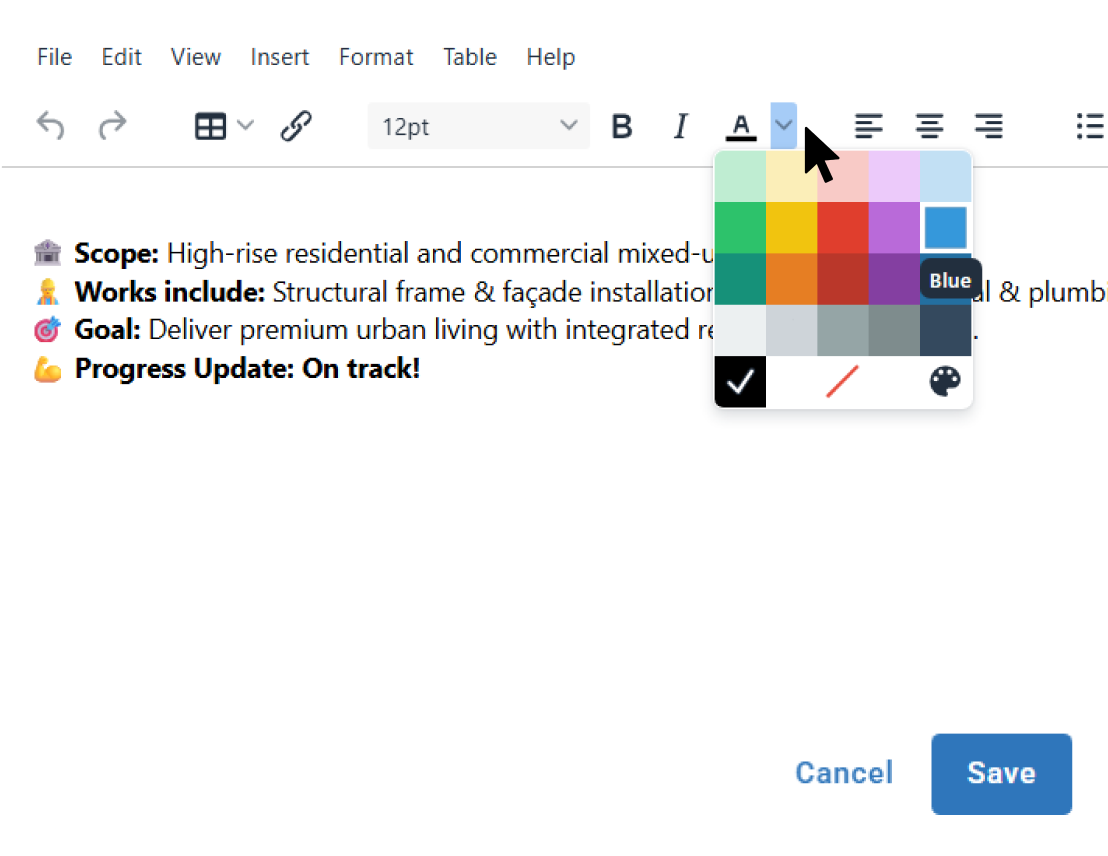
Create clearer reports with formatting and layout controls that help teams standardize how updates are presented. Customize text layout, font, and style settings, as well as word-style formatting options, for more structured reporting.
🎨 Customize text layout and positioning inside dashboards and reports.
🔤 Adjust font, size, color, and style to match branding or highlight key information.
📋 Format text with tables, lists, and other word-style options.
Become superhuman with AI today. Free to start, simple to scale.

Your first project is on us — no credit card required. Get started instantly with core tools.
.svg)
Flexible month-to-month plan, payable by credit card. Add projects as you grow and access free videos, training, and guides.
per month

Full enterprise features, advanced security, and dedicated human rollout support.

Build dashboards with a ready-to-use library of charts and visualizations.
Learn more
Andrew Benn, WSP Technical Director
"With Mastt, our client can see the status of the project anytime, reducing back and forth queries, and not having to wait until the end of the month to receive a monthly report."
Read Case Study
Rebecca White, RPS Program Manager
"Mastt has saved our team significant time and effort in managing the financials elements of 65+projects. The team now has total visibility over their individual projects as well as the overarching program of works."
Read Case Study
Erik Maasepp, Capital Insight Senior Project Manager
"Mastt takes away a lot of user error that spreadsheets bring. With Mastt, we are able to combine multiple projects into programs or portfolios for management level analysis and direction."
Read Case Study
CAPT. Dan Foley, Army Digital Transformation Manager
"Mastt is increasing the team’s tempo and productivity by enabling real time information across our portfolio of projects. This transparency is assisting us to make informed decisions, to identify opportunities and reduce the risk."
Read Case Study
Dan Atkins, Jacobs National Program Manager
"Mastt's ability to record critical financial information as well as program forecasted delivery and milestones put Jacobs in a favourable position to our clients."
Read Case Study.webp)
Mohammed Salameh, Compass' Associate Director
"Moving to Mastt is one of the best decisions my team has ever made. It’s cost-effective, easy to use, and a quick set up."
Read Case Study.webp)
Fergus Bruce, Project Manager at WSP
"A key factor in our decision to adopt Mastt is its user-friendliness. It had to continue to empower us to work smart, allowing us to consistently deliver excellence across multiple sectors and geographic regions."
Read Case Study


