


Construction cost analysis is the process of reviewing and tracking project costs to understand how money is being spent during construction. It looks at actual construction costs, giving project teams a clear view of budget performance as work moves forward.
In this article, we’ll explain how construction cost analysis works, why it matters on active projects, and how it supports better cost reporting and day-to-day decisions on-site.
What is Construction Cost Analysis?
Construction cost analysis is the process of tracking, reviewing, and evaluating actual costs against the approved budget throughout the project lifecycle. It examines labor, material, equipment, and overhead costs to determine whether spending aligns with planned estimates.
The cost analysis process involves breaking costs into defined categories, comparing estimated and actual costs, and identifying variances that affect the total project cost. This allows project teams to detect cost overruns early, manage financial risk, and maintain control over profit margins.
Cost analysis in construction also supports accurate cost reporting by turning cost data into clear, consistent financial insight. This information is used to forecast final cost, support stakeholder decisions, and improve cost management on current and future construction projects.

Construction Cost Analysis vs Cost Estimating: What’s the Difference?
Construction cost analysis and cost estimating serve different purposes at different stages of a construction project. Construction estimating predicts what a project is expected to cost, while construction cost analysis evaluates what the project is actually costing as work progresses.
Cost estimating happens before construction starts and is based on assumptions, quantities, and pricing at a point in time. Construction cost analysis happens during delivery and uses real cost data to measure performance, identify overruns, and support cost reporting and decisions.
Why Cost Analysis Matters in Construction Projects
Cost analysis is essential in construction because it shows how a project is really performing financially while work is underway. It gives project teams early visibility into cost issues, supports better decisions, and reduces the risk of overruns that surface too late to fix.
Here’s why project teams rely on cost analysis to stay in control:
- Early detection of cost overruns: Cost analysis flags when labor, materials, or equipment costs deviate from budget, allowing teams to course-correct before overruns compound.
- Stronger cost control during delivery: Regular analysis keeps spending aligned with the approved project budget instead of relying on assumptions or delayed reports.
- Better decision-making on site: Clear cost insight helps project managers decide where to adjust sequencing, staffing, or procurement without guesswork.
- More reliable cost reporting: Analyzing cost data leads to clearer, defensible reports for owners, lenders, and internal leadership.
- Protection of profit margins: By understanding what is driving costs in real time, contractors can respond before margin erosion becomes permanent.
Construction projects operate on tight margins and long timelines, which makes delayed cost visibility especially risky. Cost analysis closes the gap between what was planned and what is happening on a project. It turns raw cost data into information teams can use to manage risk, schedule, and cash flow.

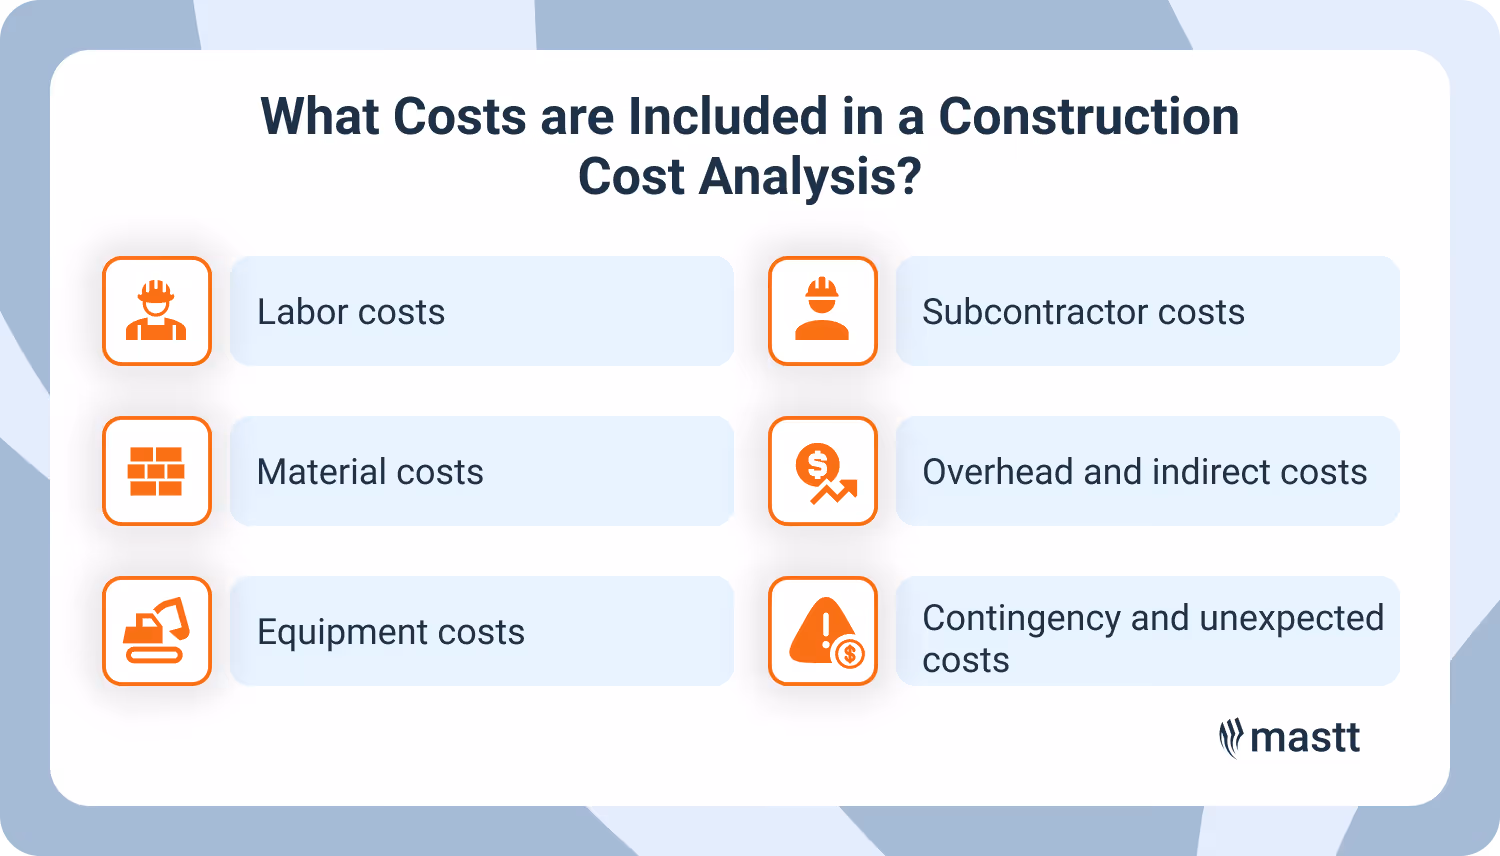
What Costs are Included in a Construction Cost Analysis?
A construction cost analysis covers every cost that affects the total project spend, not just what shows up on invoices. It pulls together direct, indirect, and supporting costs so teams can see the full financial picture as work progresses.
Here’s what a complete construction cost analysis typically includes:
- Labor costs: Wages, payroll burden, overtime, and labor hours tracked against productivity and progress on site.
- Material costs: Purchased materials, deliveries, price escalations, and waste that affect unit cost and total spend.
- Equipment costs: Owned or rented equipment, including operating time, maintenance, fuel, and standby costs.
- Subcontractor costs: Contract values, approved changes, and progress payments tied to completed work.
- Overhead and indirect costs: Site overhead, supervision, temporary facilities, permits, insurance, and other project support expenses.
- Contingency and unexpected costs: Allowances and unplanned expenses that arise from scope changes, delays, or site conditions.
💡 Pro tip: Track indirect and overhead costs with the same discipline as direct costs. When site overhead is spread evenly across the schedule rather than tied to time on-site, schedule delays can quietly erode profit without showing up as a clear cost overrun.
What are the Common Methods Used in Construction Cost Analysis?
Construction cost analysis uses a set of established methods to evaluate spending, explain variances, and forecast final project cost. Each method looks at cost from a different angle, depending on how detailed the analysis needs to be and where the project sits in its lifecycle.
💡 Pro tip: Don’t apply advanced methods without first stabilizing basic cost data. Variance and productivity analysis only work when cost coding, quantities, and progress tracking are disciplined. Weak inputs make sophisticated methods misleading instead of helpful.
How to Perform Cost Analysis for a Construction Project
To conduct cost analysis, you have to review actual spending against the approved budget on a regular basis and use that information to manage risk. The process turns cost data into clear insight that supports day-to-day decisions during delivery.
Step 1: Define the approved cost baseline
Start with the current approved budget, including any approved changes. This baseline is what actual costs should be measured against, not the original estimate. If the cost baseline is unclear or outdated, cost analysis will point to problems that do not actually exist.
Step 2: Capture actual costs consistently
Collect real cost data from labor timecards, material invoices, equipment logs, and subcontractor pay applications. Costs should be recorded promptly and coded correctly so they reflect what is happening on site, not weeks later.
Step 3: Organize costs in categories
Group costs into clear categories such as labor, materials, equipment, subcontractors, and overhead. Use consistent cost codes so trends and variances are easy to spot across reporting periods and work areas.
Step 4: Compare actual costs to budget and commitments
Review how actual spending compares to the budget and to committed costs. Look for gaps between what was planned, what has been committed, and what has already been spent. These gaps often signal future overruns before they show up in reports.
Step 5: Identify variances and cost drivers
Focus on where costs are drifting and why. Labor productivity, material price changes, scope shifts, and schedule delays are common drivers. The goal is to understand the causes of these variances.
Step 6: Forecast the remaining cost to complete
Update the expected cost to finish the work based on current performance. This forecast should reflect real productivity and spending trends.
Cost analysis works best when it aligns with the construction schedule. Reviewing costs as work progresses keeps cost reporting accurate and gives teams time to respond before overruns harden.
Example of a Construction Cost Analysis for a Commercial Building
This example applies a comparative cost analysis method, using adjusted historical project data to flag cost risk before overruns are locked in.
Project overview
A contractor is delivering a 15,000-square-foot, single-story commercial building with office and light assembly space. The project includes basic interior finishes, rooftop HVAC units, and surface parking. The planned construction duration is nine months.
Establishing a realistic benchmark
Instead of using a single cost-per-square-foot number, the project team reviews three recently completed projects with similar use, structure, and finish level. After adjusting for location and market conditions, the historical data shows:
- Comparable project range: $235-$255 per square foot
- Expected midpoint benchmark: $245 per square foot
That sets a reasonable target construction cost of about $3.7 million.
Comparing the benchmark to live project data
By the end of the third month, the project team reviews committed and actual costs:
At this point, the project is not over budget. The concern is that committed costs are already trending toward the upper end of the benchmark range earlier than planned.
A closer review shows:
- Structural steel pricing is higher than on past projects
- Mechanical packages were awarded earlier due to long lead times
- Finishes have not yet been fully bought out
How the analysis supports real decisions
This analysis tells the project manager that cost pressure is coming from market conditions, not site performance. That insight changes the response. Instead of chasing labor productivity, the team focuses on procurement strategy, scope clarification, and updating the cost forecast to reflect current pricing reality.
💡 Pro tip: Comparative cost analysis is most valuable before the project “feels expensive.” If commitments hit the top of your benchmark range early, treat that as a signal to reforecast immediately. Waiting for actual costs to catch up is how overruns turn permanent.
How to Standardize Cost Analysis Across Construction Projects
Keep cost analysis consistent by using the same cost structure, budget baseline, review schedule, and reporting format across all projects. This standardization allows teams to compare performance across jobs, spot trends early, and trust cost reporting at both the project and portfolio level.
1. Use a common cost structure
Adopt a standard cost framework across all projects. Many teams use the Construction Specifications Institute’s CSI MasterFormat divisions or the RICS Elemental Standard Form of Cost Analysis (NRM) to group costs consistently.
A shared structure keeps labor, materials, equipment, and overhead aligned across jobs and prevents confusion when comparing projects.
2. Lock the approved cost baseline
Establish a clear approved budget before tracking begins, including approved scope changes. This baseline is the reference point for all cost analysis. If budgets shift informally, cost trends become unreliable, and reports lose credibility.
3. Review costs on a fixed cadence
Analyze costs weekly or at defined progress milestones. Regular reviews surface issues while they are still manageable. Delayed reviews turn cost analysis into hindsight.
4. Tie cost analysis to progress
Align cost reviews with the percent complete and installed work. Spending should move in step with progress. When it does not, the variance needs investigation.
5. Use a consistent reporting format
Standardize how cost analysis results are presented, including variance explanations and forecast updates. When reports follow the same format across projects, leaders can focus on decisions instead of interpretation.
Standardization does not remove judgment from cost analysis. It creates a stable framework, ensuring judgment is applied consistently rather than reinvented on every project. Over time, standardized cost analysis improves forecasting accuracy and builds a reliable cost history.
Better Cost Reporting Starts With Cost Analysis
Cost reporting only adds value when it reflects what is actually happening on the project. Construction cost analysis links spending to progress and scope, making variances easier to explain and forecasts more reliable. Without it, reports arrive too late to support decisions and only explain what has already gone wrong.

Written by
Anna Marie Goco
Anna is a seasoned Senior Content Writer at Mastt, specialising in project management and the construction industry. She leverages her in-depth knowledge to create valuable content that helps professionals in these fields. Through her writing, she contributes to the company's mission of empowering project managers and construction professionals with practical insights and solutions.


Contributions by
Project Cost Report
Use this FREE Project Cost Report Template to track, analyze, and communicate your project’s financial performance. Compare budgeted, committed, and actual costs to stay on top of your budget.

Walk Into Every Meeting With Confidence, Clarity, and Control
No one wants to look unprepared, blindsided, or uncertain in front of stakeholders — but that’s exactly what happens without Mastt.
Start for FreeTrusted by the bold, the brave, and the brilliant across governments, Fortune 500s, and the world’s best in delivering the future

![What to Include in a Construction Cost Report [Examples]](https://cdn.prod.website-files.com/607f739c92f9cf647516b37b/673325cfc0431e0bcb96cbb8_66fa6b3e729571b2ca1ef55d_What%2520to%2520Include%2520in%2520a%2520Construction%2520Cost%2520Report.avif)
![What to Include in a Construction Cost Report [Examples]](https://cdn.prod.website-files.com/607f739c92f9cf647516b37b/63d87efa7c9fde41daf46741_Mastt_headshots_%20(54).avif)