

.avif)
This 2026 research breaks down Australia’s construction industry, covering market size, workforce, infrastructure, costs, productivity and outlook.
This page is a citable reference to the construction industry in Australia. Every statistic is linked to its primary source and labelled with its reference period, and the key series are presented as tables for reuse. Where a figure is our own calculation from published data, we say so. Please cite as: Mastt, Construction Industry in Australia: 2026 Statistics & Market Outlook, mastt.com.
Note on definitions: "market size" can mean different things. Industry value added, total income, construction work done and pipeline value measure different concepts and are not interchangeable. Each is labelled below.
Construction industry value added (IVA) reached $191.8 billion in 2024-25, up 7.9% from $177.6 billion in 2023-24 (ABS, Australian Industry 2024-25, released 19 June 2026). The same release records construction employment of 1,313,000 people at end June 2025 (up 1.3%), sales and service income growth of 6.8%, earnings (EBITDA) growth of 6.1% to $67.1 billion and operating profit before tax up 9.0% to $63.4 billion. Purchases of goods and materials rose 8.5% ($21.4 billion), which the ABS attributes to continued pressure from rising construction material costs.
On a workforce basis, the ABS Labour Account recorded 1,342,100 people employed in construction in the June quarter 2026, across 1,374,200 total jobs and 1,354,800 filled jobs. Construction filled jobs rose 1.1% in the quarter and 4.9% over the year, and construction was one of the three largest employing industries alongside health care and retail (ABS, Labour Account Australia, June 2026, released 4 September 2026).
The Australian Construction Industry Forum (ACIF) May 2026 Forecasts project that total building and construction work could contract by 0.8% in 2026, after 3.6% growth in 2025 (ACIF, May 2026 Forecasts summary).
ACIF attributes the downgrade from its November 2025 outlook to higher fuel prices, renewed inflationary pressure and the prospect of higher interest rates, and notes that residential building is the sector most exposed to changes in household borrowing capacity.
ABS preliminary, seasonally adjusted data for the June quarter 2026 shows $82.5 billion of total construction work done, down 2.1% quarter on quarter (qoq) but up 2.7% year on year (yoy). The trend estimate rose 0.7% to $82.0 billion (ABS, Construction Work Done, Australia, Preliminary, June 2026, released 26 August 2026).
Seasonally adjusted, chain volume measures, reference year 2023-24. These are preliminary estimates with a response rate of approximately 80% and are subject to revision in the ABS Engineering Construction Activity release (30 September 2026) and Building Activity release (7 October 2026).
Building work done has risen for four consecutive quarters and is at its highest level in the eight-year series. Engineering work done peaked at $39.0 billion in the March quarter 2026 before falling back in June. June-quarter values, seasonally adjusted chain volume measures (ABS):
Totals are the sum of the ABS building and engineering series. Over eight years, total construction work done has grown 13.0% in volume terms, with engineering up 16.1% and building up 10.7%.
Residential building work done, at $27.9 billion, has only just regained its June 2018 level of $27.8 billion, while non-residential building has grown 30% from $13.8 billion to $18.0 billion over the same period.
Total construction work done by state and territory, June quarter 2026, seasonally adjusted chain volume measures (ABS, Construction Work Done, June 2026):
New South Wales, Victoria and Queensland together account for roughly 74% of national construction work done (our calculation from the ABS state figures). Western Australia's 19.7% quarterly fall follows an unusually strong March quarter; the Northern Territory's 81.3% annual fall reflects the wind-down of a small number of large resource projects that inflated the June 2025 base. Small jurisdictions are volatile quarter to quarter and are best read on an annual basis.
Infrastructure Australia's 2025 Infrastructure Market Capacity Report tracks $1.14 trillion of construction activity across the five years from 2024-25 to 2028-29. Public spending accounts for 28% of that total: $242 billion (22%) in the Major Public Infrastructure Pipeline and $66 billion (6%) in small capital projects (Infrastructure Australia, 2025 Infrastructure Market Capacity Report, November 2025).
The Major Public Infrastructure Pipeline (MPIP) totals $242 billion, up 14% ($29 billion) on the prior year's outlook and the highest level since Infrastructure Australia began tracking in 2020. Within the MPIP, transport accounts for $129 billion (53%), buildings $77 billion and utilities $36 billion, with utilities investment projected to more than double over five years.
Separately, state and territory budgets allocated $278 billion of general government expenditure to infrastructure over the four years to 2028-29, a nominal increase of $7.6 billion on the prior budget season (Infrastructure Partnerships Australia, Australian Infrastructure Budget Monitor 2025-26).
ABS data shows construction multifactor productivity (MFP) fell 2.8% in 2024-25, which the ABS attributes to strong growth in hours worked required to complete large-scale infrastructure projects.
Across the whole market sector, MFP fell 0.5% and labour productivity fell 0.2%, with falls in mining and construction detracting 1.0 and 0.3 percentage points respectively from aggregate labour productivity growth (ABS, Estimates of Industry Multifactor Productivity, 2024-25, released 6 February 2026).
Deloitte Access Economics' Investment Monitor, released 8 February 2026, found that across 13 publicly funded projects valued at $10 billion or more, latest cost estimates are collectively around $130 billion higher than initial estimates, equivalent to more than the entire value of residential construction work done across Australia in the past year (Deloitte Access Economics, Investment Monitor: Cost blowouts arrive). The same database contains more than $415 billion of definite public infrastructure projects, with a further $160 billion in planning.
There is no reliable single Australia-wide percentage for rework cost, because published studies use different definitions and project types, and contractors rarely share non-conformance data.
A peer-reviewed study of 14 Australian infrastructure projects totalling $2.34 billion, forming part of a mega-project programme, analysed 1,097 non-conformances and found a mean non-conformance cost of 0.41% and a mean rework cost of 0.30% of contract value. Root causes were processes and methods not being followed and defective materials (Love, Matthews & Mahamivanan, 2025, International Journal of Production Research).
A separate 2025 study in the Journal of Construction Engineering and Management found actual field rework costs averaged 0.38% of contract value before completion, were under-reported by around 300%, and roughly doubled to 0.76% once post-completion corrections were included (Love et al., 2025, ASCE).
These figures apply to the specific project samples studied and should not be presented as national industry averages.
Safe Work Australia recorded 37 construction worker fatalities in 2024, equal to 20% of Australia's 188 work-related traumatic injury fatalities. Construction ranked third behind transport, postal and warehousing (54) and agriculture, forestry and fishing (44) (Safe Work Australia, Key Work Health and Safety Statistics Australia 2025). Dividing 37 fatalities by the Labour Account's 1.34 million construction workers implies a rate of roughly 2.8 per 100,000 workers; this is our calculation, not a published Safe Work Australia figure.
Construction accounted for 12% of Australia's 146,700 serious workers' compensation claims in 2023-24p (preliminary), roughly 17,600 claims, making it the second-largest industry for serious claims behind health care and social assistance (19.9%) (Safe Work Australia, Key WHS Statistics Australia 2025, PDF).
Analysis of ASIC insolvency statistics released 13 July 2026 (data to 28 June 2026) shows 3,435 construction companies entered external administration for the first time in 2025-26, down 4.5% from the record 3,596 in 2024-25. This is the first annual fall in construction insolvencies since the post-COVID wave began.
Construction accounted for approximately 24.5% of all first-time company insolvencies in 2025-26 and has been the largest single industry for corporate failure every year since 2021-22 (ASIC, Insolvency statistics, Series 1; The Good Builder analysis, 21 July 2026). ASIC itself reported construction at 27% of external administrations in 2023-24.
For context, there were 462,939 construction businesses operating in Australia at 30 June 2025, more than any other sector, with 98.6% employing fewer than 20 people (Master Builders Australia, citing ABS Counts of Australian Businesses). ABS data records 66,412 construction business exits in 2024-25, 28% more than the next-highest industry (Building 4.0 CRC, Project 80 report, October 2025). Dividing ASIC's 3,596 insolvencies by 66,412 exits gives roughly 1 in 18 exits (5.4%) attributable to formal insolvency; this is our calculation. Most business exits are voluntary closures, ABN cancellations or restructures rather than insolvencies.
Infrastructure Australia estimates the industry is currently short 141,000 workers needed to deliver the five-year Major Public Infrastructure Pipeline (Infrastructure Australia, 2025 Infrastructure Market Capacity Report). Infrastructure Australia's modelling has workforce demand peaking at around 521,000 workers in 2027, with the shortfall projected to reach 300,000 (as reported by Mortgage Professional Australia, August 2026).
The Housing Industry Association (HIA) estimates Australia needs an additional 83,000 skilled tradespeople, a 30% increase on the approximately 278,000 employed across twelve key residential trades, to meet the National Housing Accord target of 1.2 million new homes over five years (HIA, All Hands on Deck report, October 2024). HIA reaffirmed the 83,000 figure in July 2026, when its Trades Availability Index remained in shortage territory at -0.59 (HIA, July 2026).
Australian construction firms use an average of 7.6 technologies, up from 6.9 a year earlier, and 60% use construction-management cloud software, the most widely adopted technology. On average, 48% of Australian construction employees use construction-specific technology each week, second only to Vietnam among the six markets surveyed. The research covered 954 businesses across Asia-Pacific, including 287 in Australia (Autodesk and Deloitte Access Economics, State of Digital Adoption in the Construction Industry 2026).
Data centre construction has become one of the fastest-growing segments of Australian non-residential building. The ABS records data centre buildings under "commercial building not elsewhere classified" in its Building Activity series. Work done in that category reached approximately $1.03 billion in the September quarter 2025, up 246% since March 2022 (ABS, Spotlight: Data Centres in Economic Statistics, 26 February 2026).
Approvals point to further growth: the value of commercial buildings not elsewhere classified approved reached $4.29 billion in the June quarter 2025 and $2.96 billion in the December quarter 2025, compared with an average of well under $1 billion a quarter through 2021-2023.
Businesses in the Information, Media and Telecommunications industry expected to spend $19.2 billion on capital investment in 2025-26, up 51.7% on the prior year, with a first estimate of $20.1 billion for 2026-27, up 74.9% on the equivalent estimate a year earlier. Equipment, plant and machinery investment in the same industry, which captures data centre fit-out, hit a record $2.6 billion in the September quarter 2025, up 143% on the year (ABS, as above).
Deloitte Access Economics notes that Australia's data centre construction boom is now competing with public infrastructure for limited construction capacity (Deloitte Access Economics, Investment Monitor, February 2026).
Statistics on this page are drawn from primary Australian sources and labelled with their reference period, because releases are published on different schedules. Where a newer official figure exists, it replaces the older one. Where a figure is Mastt's own calculation from published data, it is identified as such in the text.
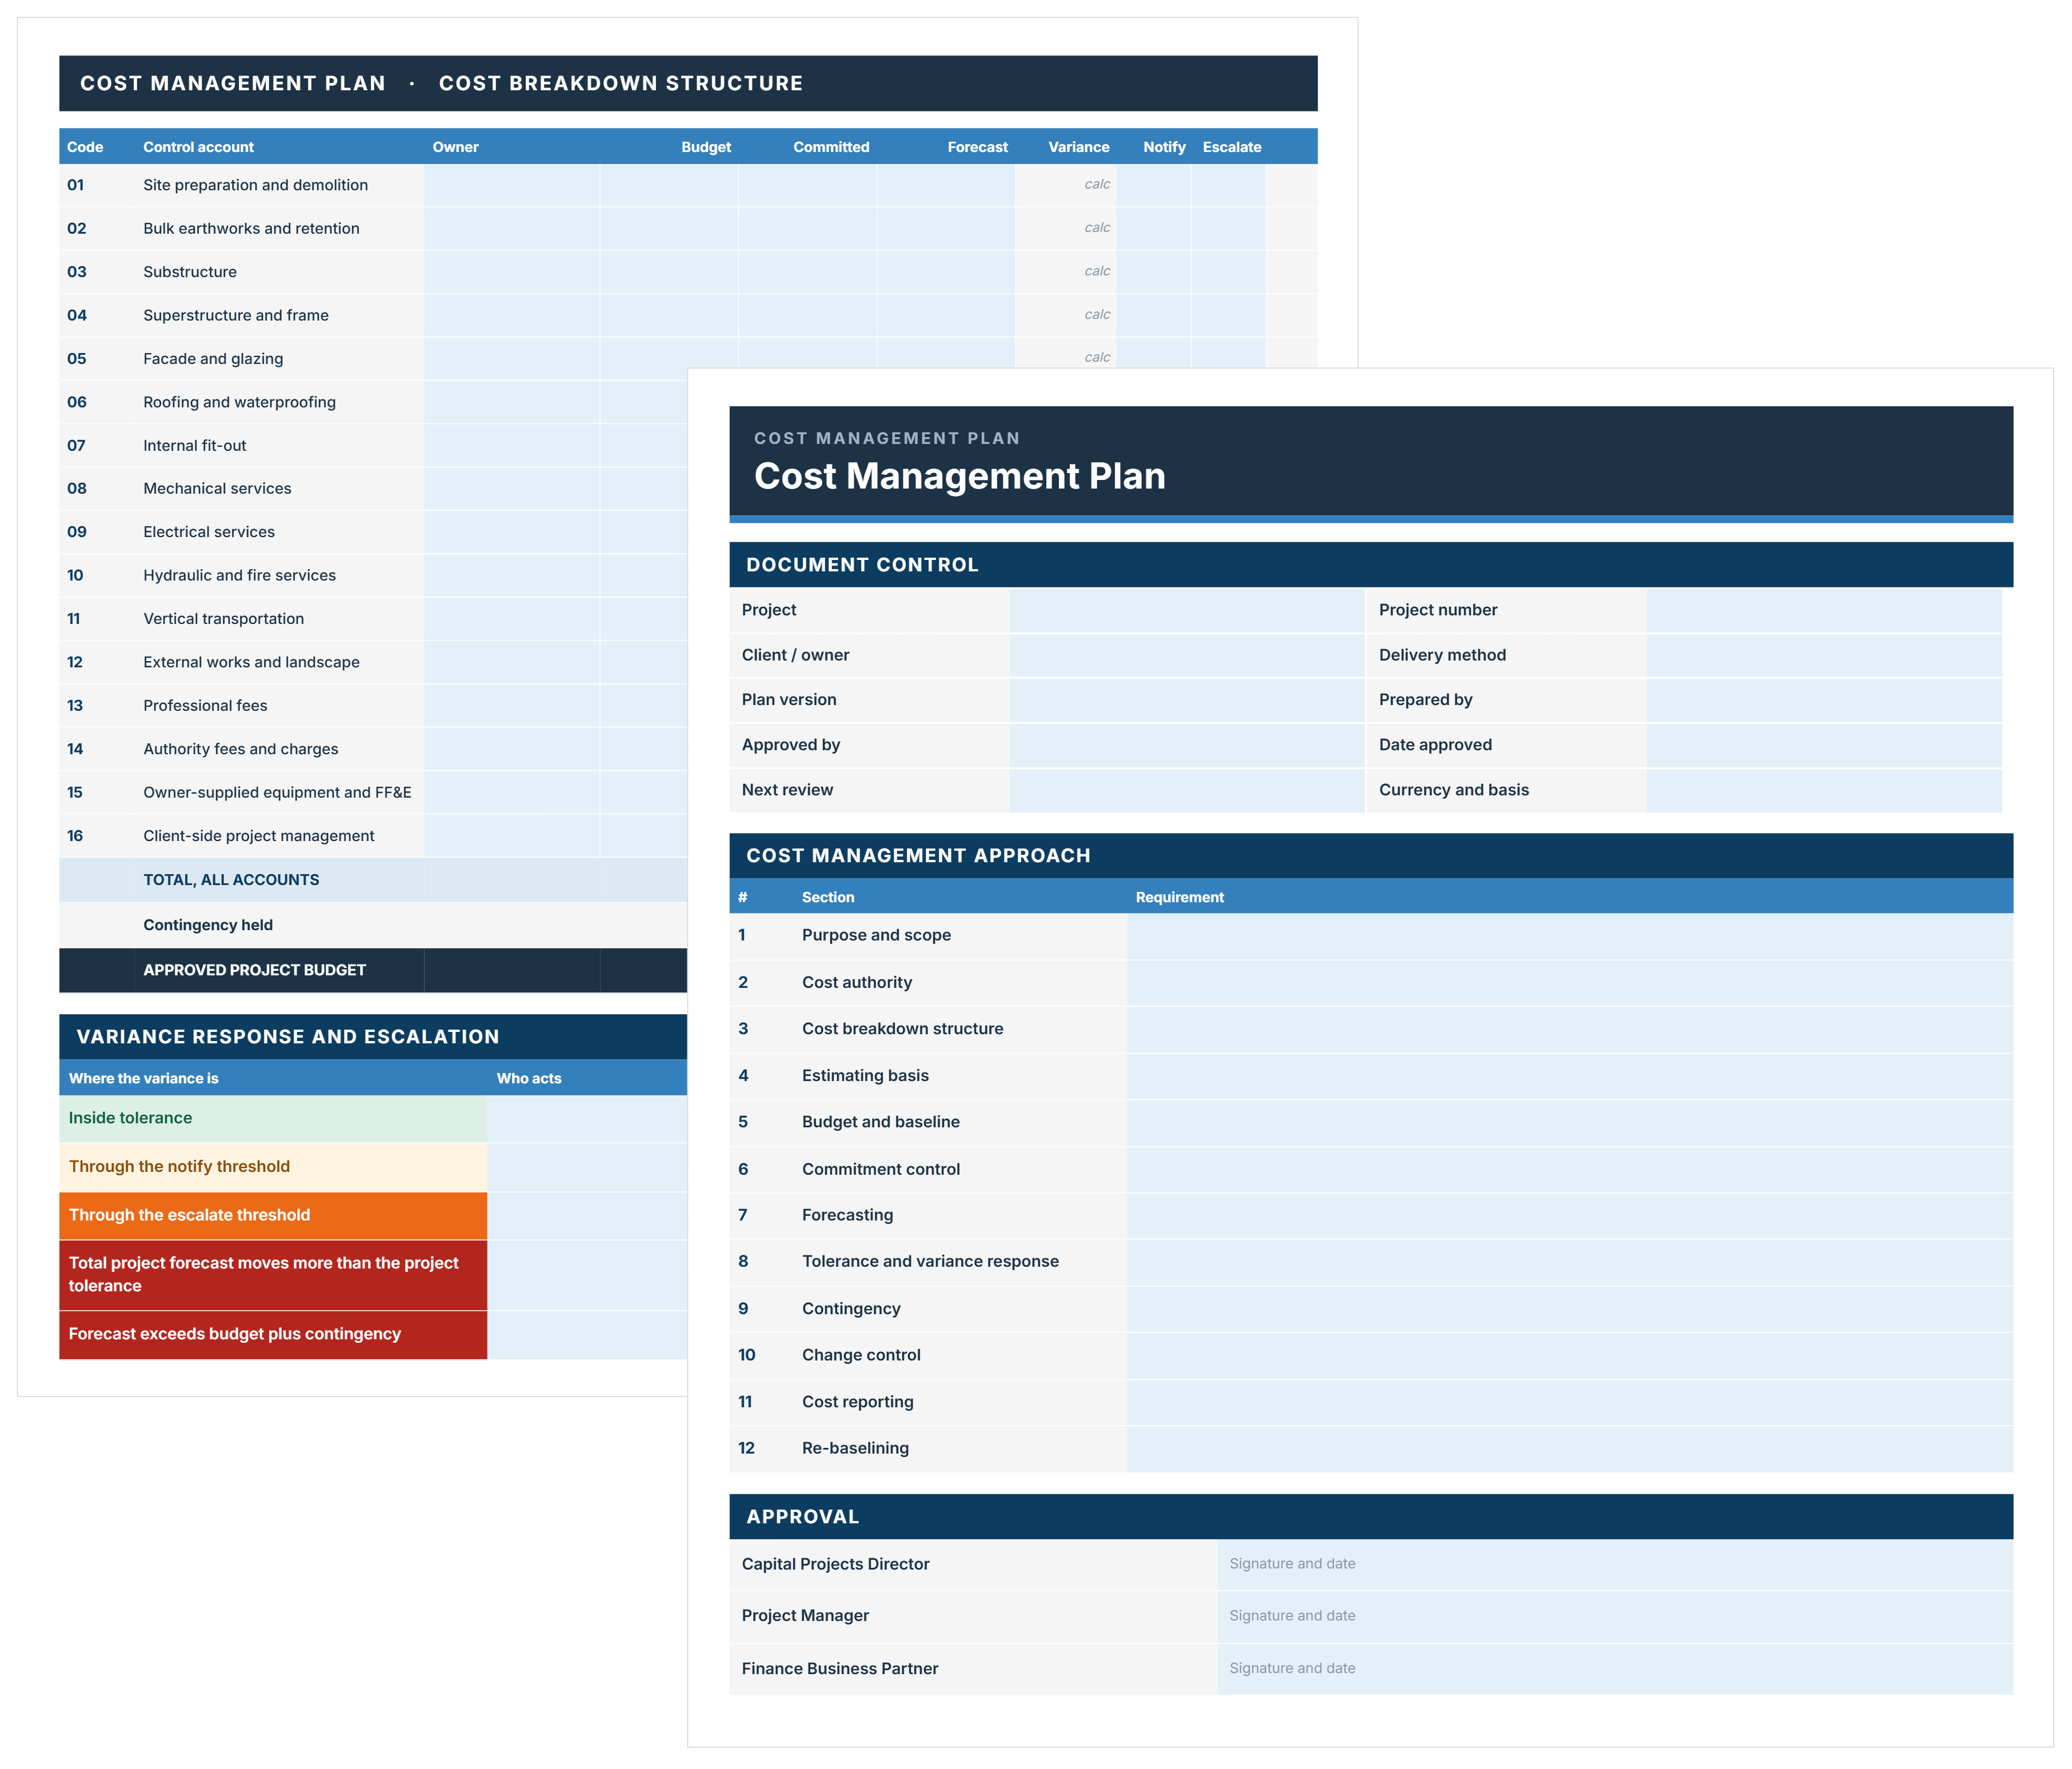
FREE project cost management template in Excel. Set the cost management plan, the control accounts, and the tolerances that trigger escalation, then track against it.
Written by
Doug Vincent is the co-founder and CEO of Mastt, the AI capital-project management platform used by governments, Fortune 500 companies, and consultancies across APAC, North America, and MENA. Before founding Mastt in 2019, he spent a decade at RPS delivering more than $2 billion in capital works, including the $2.1B Defence Navy Infrastructure program, and holds a CPSPM certification with the AIPM. He contributes content and speaks on AI in capital project delivery at Mastt.


