

When you're swamped with all project information and your only ally is a clanky, old software or tool, you'll find yourself struggling to keep things in order. However, crafting a comprehensive Project Control Group (PCG) report is essential for project managers in the construction industry, because you're dealing with critical, decision-making information about the project.
But it doesn't have to be such a tedious chore! This vital document guides critical project decisions and ensures capital projects stay on track, within budget, and meet quality standards.
To make it easier, we created this guide and broke down the key elements to include in your PCG report and make it truly effective.
What is a PCG Report?
A PCG report is a formal document that provides a detailed overview of a construction project's status. Traditionally, these reports were prepared in A4 Portrait format using Microsoft Word. However, forward-thinking Project Management Consultants now use A4 Landscape 'dashboard style' PCG Reports with mostly visualizations. This innovative style saves time and also serves as a great prop for PCG Meetings.

What to Include in a PCG Report
There is no one or definite way to write a PCG report as it may vary on each project or audience. However, there are key elements that a PCG report should have to make it as comprehensive as possible, making it a complete guide of everything you need to know about the project. Let's get right on it!
Project Details
The first section of your PCG Report is the Project Details. These details are the basic information that helps identify which project is this report for. This includes:
These details ensure that all project information and records are accurate, which are also necessary for compliance and record-keeping. It is handy to have this information on top of the document like in the image below, to quickly sort out which document is which, especially when opening multiple reports across many projects as a Project Owner.
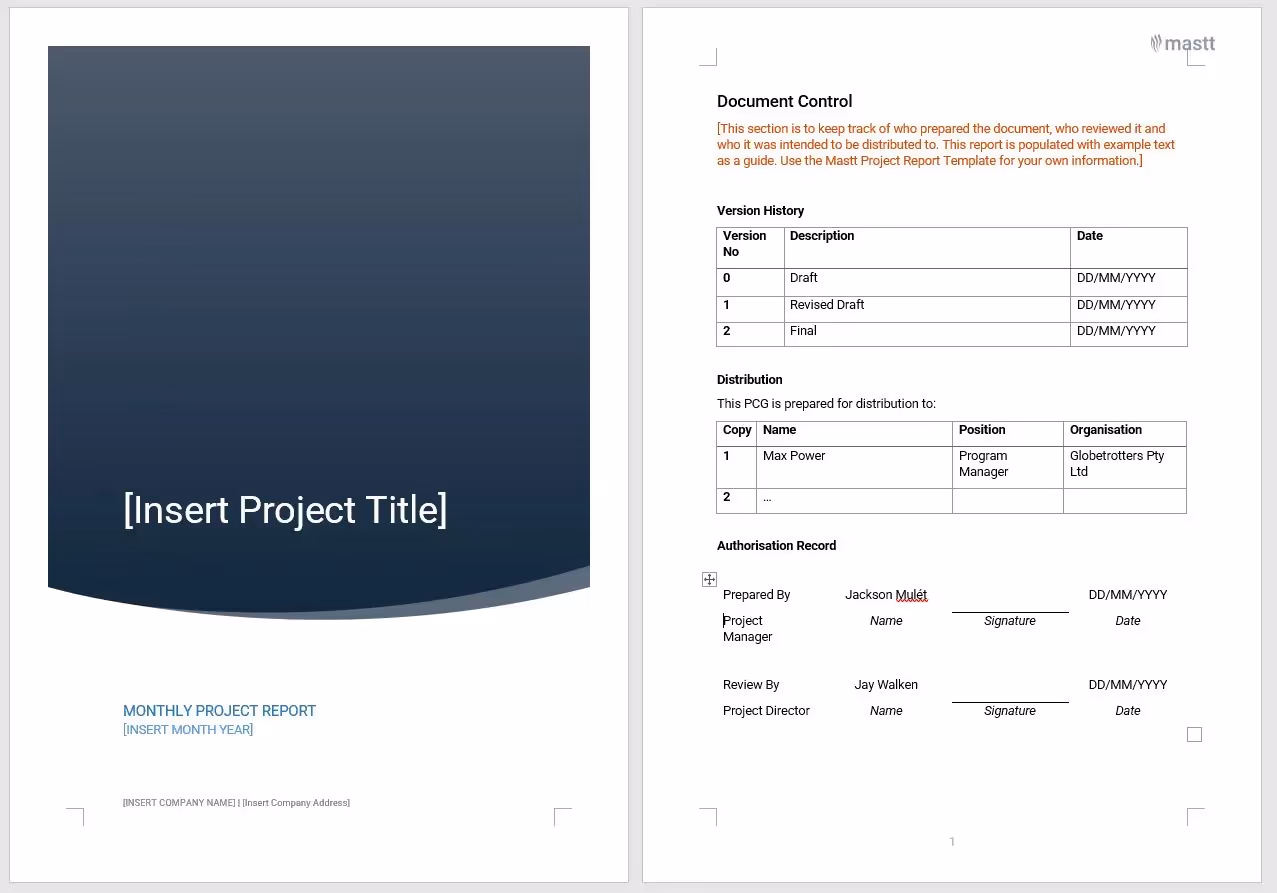
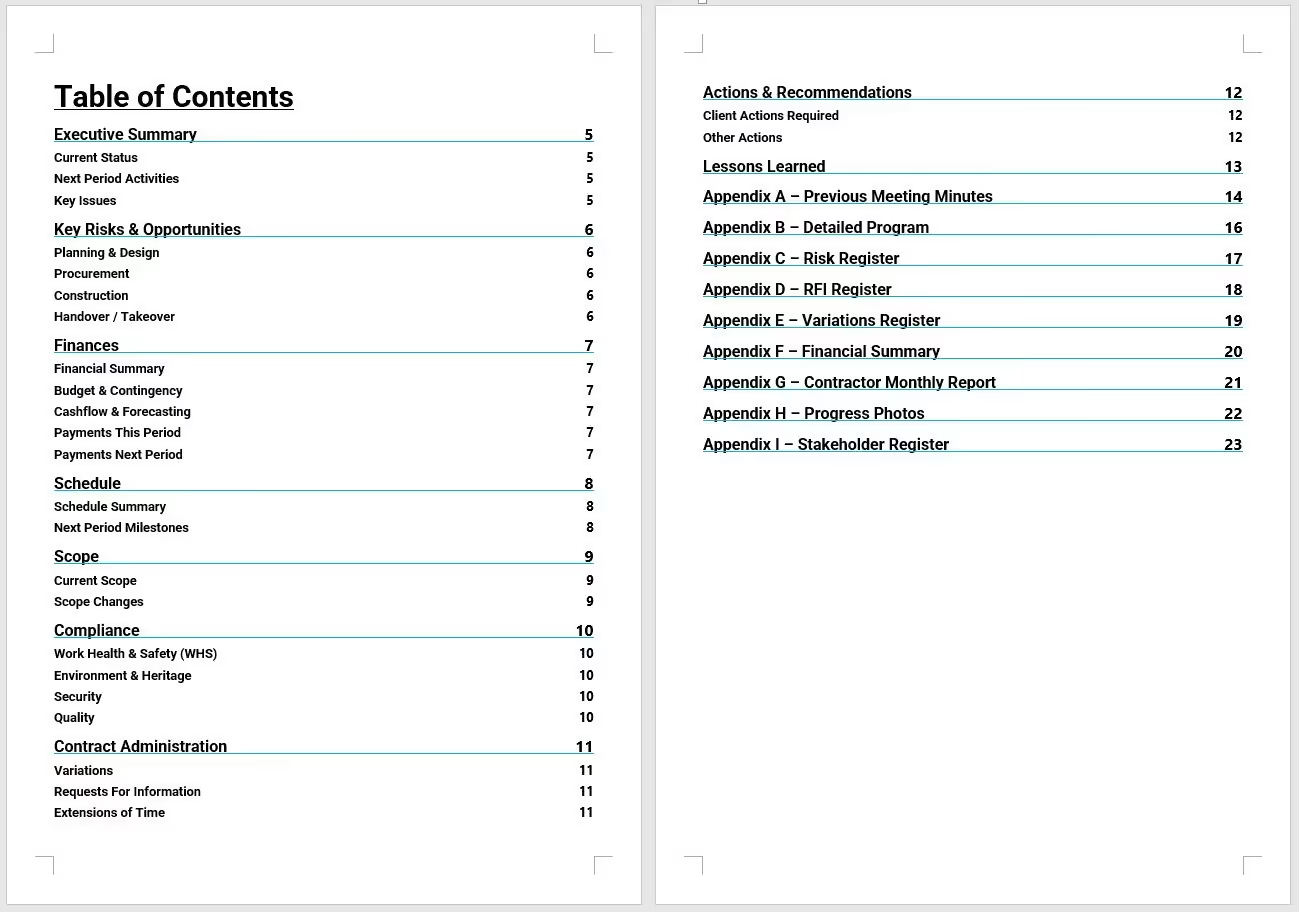
Table of Contents
The PCG Report should include a table of contents at the beginning of the report, so show the read its contents. Below is an example, however you can explore a free PCG Report template and its contents here.
Executive Summary
The Executive Summary is where you provide more information about the project, digging deeper than just the basic details. This should contain a concise, high-level summary of the project, such as:
An effective and compelling executive summary should give every ready of the entire document a clear grasp on what they expect to read in the PCG report. Think of it this way: when you read the executive summary, you'll be able to get the big and complete picture of the report. That even if you only read this part, you fully understand the current status of the project.
Of course, this does not mean that you should add a lot of specific details in here (that's what the entire report is for).
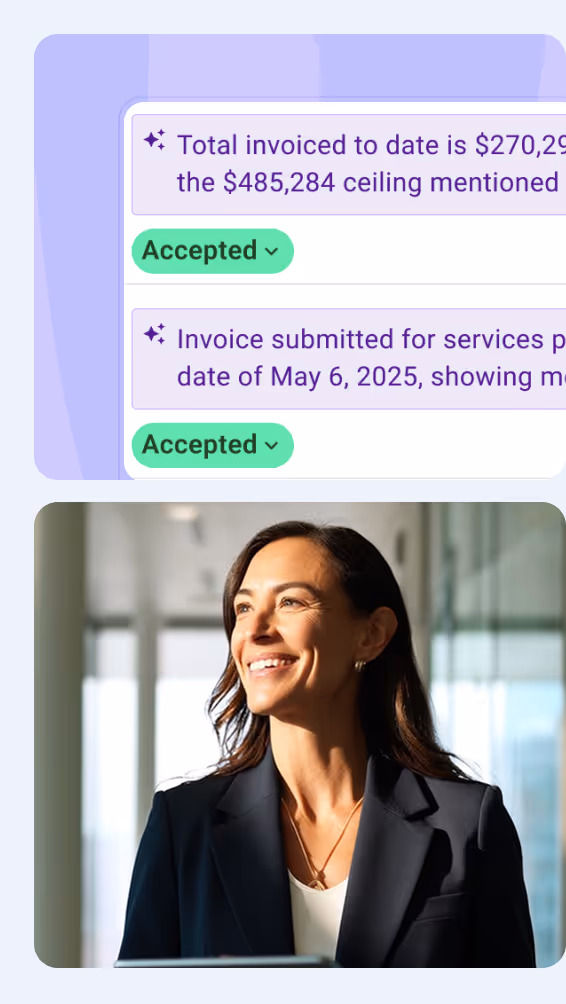
Dashboard / Current Status (Optional)
Adding a visual representation of data, especially when it involves a lot of words and numbers, is always beneficial. The purpose of a Dashboard for showing current status is to provide a concise one-page report of critical information upfront. The Dashboard could include:
- Charts
- Graphs
- Maps
- Tables
- Brief text summaries
Report dashboards can improve transparency, efficiency, communication, and decision-making within the team and the stakeholders since they help create a concrete picture of all the data discussed in the report. While some might find this an additional load to a project manager's job, tools or software that can convert data into any visual representation make it easier.
Project Scope
A Project Scope details the boundaries and expectations or what is included and excluded from the construction project deliverables. As the project manager, it's your job to keep everyone in the loop. Sharing this info with your stakeholders helps them understand exactly what's getting built (and what's not!). This way, everyone's on the same page, and there are fewer surprises down the road.
In your PCG Report, you can present:
- The primary scope items being delivered
- Scope that is not being delivered
- Scope that is being considered
- Scope variations register
- Changes made to the scope/scope alterations
- Identify any unapproved additions (e.g., scope creep) and propose ways to manage or solve them
The Project Scope should be updated regularly, especially when there are significant changes, so you and the stakeholders can assess whether the project is on track.
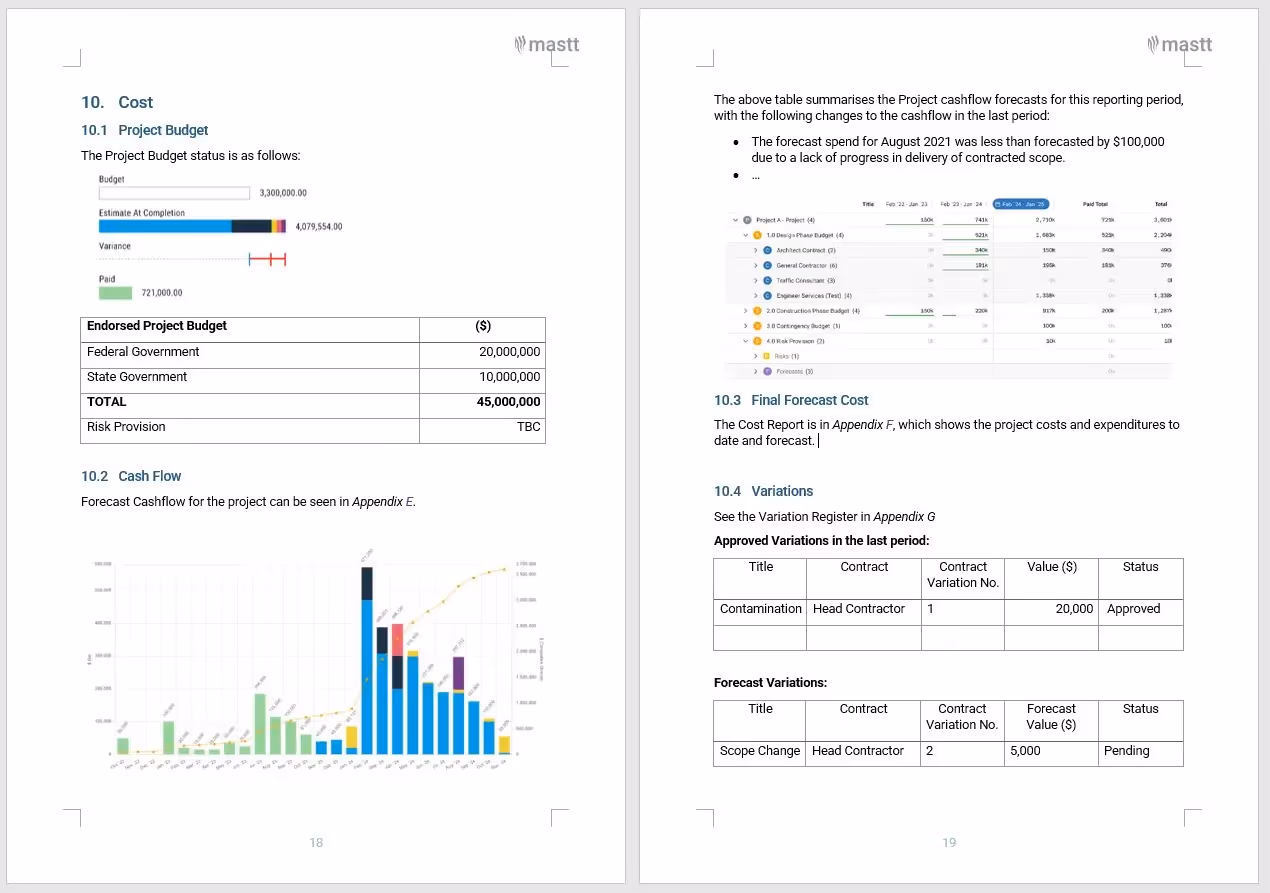
Budget or Financial Updates
The Budget & Finances part of your PCG report is like a financial checkup for your project. It shows everyone how healthy your project is money-wise. This section should give a detailed and comprehensive breakdown of the current budget and expenditures, and any variances between planned and actual spending. Here's what you should include:
- Executive Summary: Start with the big picture – how's the budget doing overall?
- Budget Breakdown: Show where the money's going, category by category, including what's left in your contingency funds.
- Budget Adjustments: List any transfers or changes you've made to the budget.
- Budget/Final Forecast Cost Report: Compare what you planned to spend with what you're actually spending, and explain any big differences.
- Forecasts and Projections: This could also be a Cash Flow subsection wherein you answer there questions: What do you expect to spend to finish the project? How's the cash flow looking?
- Variation Summary: Show how any changes to the project are affecting the budget.
- Updated Risk/Contingency Assessments: Check if you still have enough in the contingency fund to cover any unforeseen risks.
Together, this gives everyone a clear picture of your project's financial health.
Health and Safety
Construction projects are risky and life is important ❤. It takes a lot to convince the stakeholders that the project is in the right hands—meaning there are little to no incidents. The Health and Safety report should cover all that information. As a project manager, adding this section to your report shows your dedication and commitment to ensuring a safe and healthy working environment for all personnel working on the construction project.
This part of the report should include at least:
- Total Recordable Incident Rate (TRIR): Number of recordable incidents per 200,000 hours worked.
- Lost Time Injury Frequency Rate (LTIFR): Number of lost-time injuries per million hours worked.
- Severity Rate: Average time lost per lost-time injury.
- Near Miss Frequency Rate: Number of near misses reported per 200,000 hours worked.
Additionally, include safety activities and drills, training and workshops, inspections and observations, and other initiatives taken to ensure the safety of your personnel.
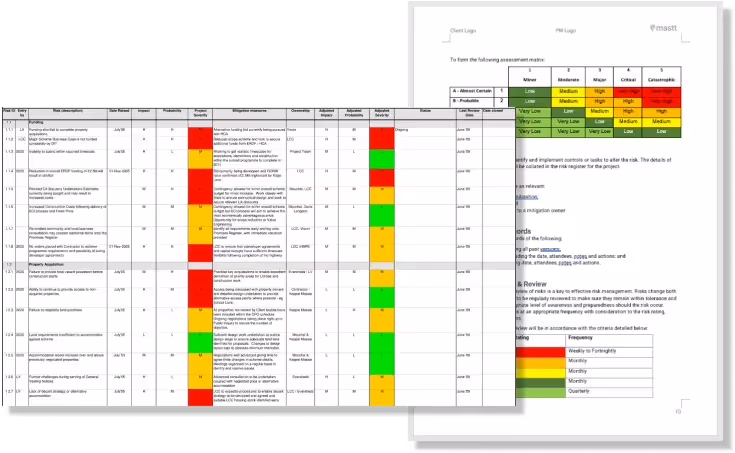
Risk and Opportunity Assessment
The Risk and Opportunity Assessment is all about looking at things that could help (opportunity) or hurt (risk) your project. It helps you figure out how to deal with potential problems and make the most of good opportunities. This assessment helps you create action plans, especially for things that need immediate attention. It's like a safety net for your project, and it helps you make smarter decisions to get the best results.
Some common risks that are discussed in a Risk and Opportunity section of a PCG Report are:
Creating a risk and opportunity assessment in the report also requires updating the risk and opportunity registers. We recommend attaching to the project report your risk registers, and including a short summary table of high or key risks in the body of the report.
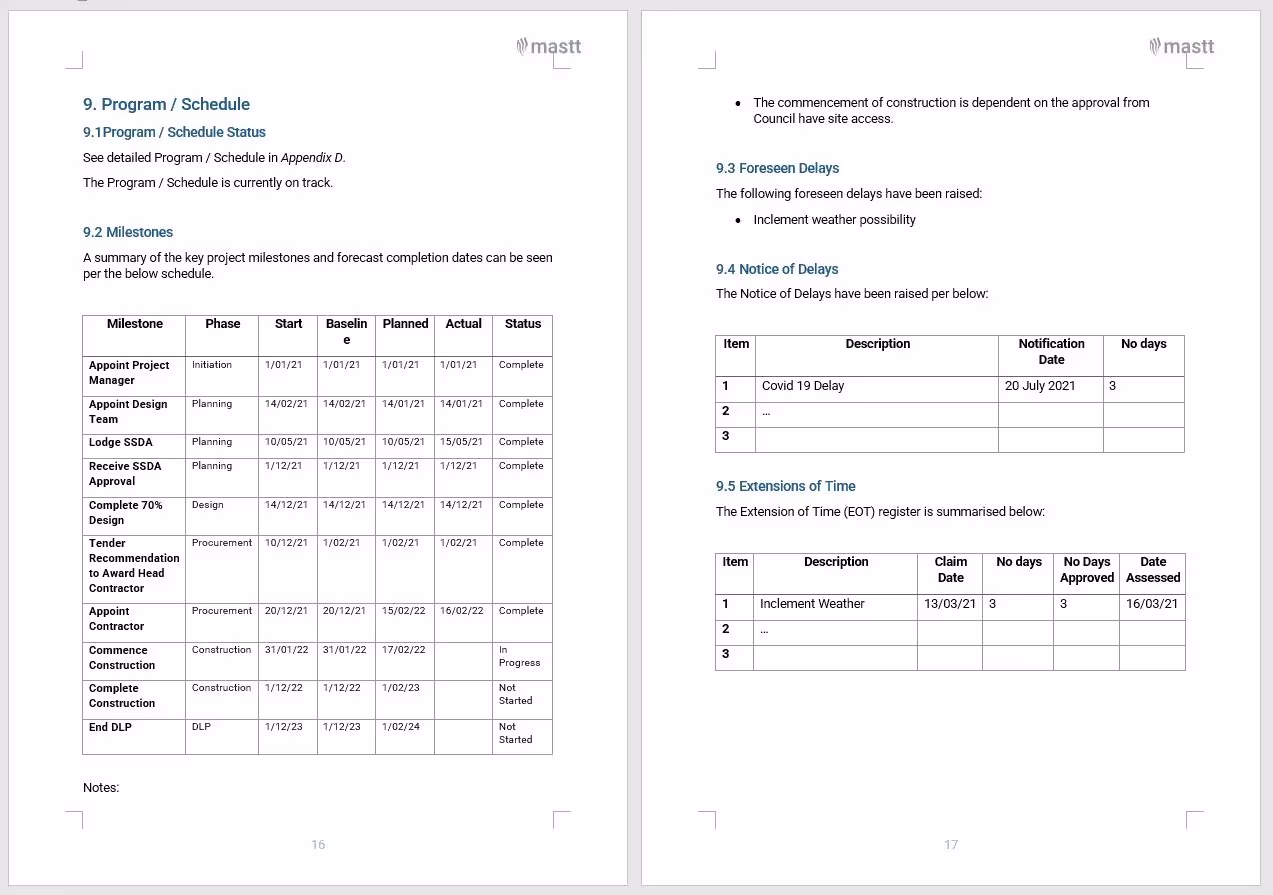
Schedule
The project schedule or timeline is a key pillar of project controls, so your PCG Report should provide an overview of how the project is progressing against the approved schedule, showing a breakdown of milestones achieved and upcoming. Identify any foreseen delays, notices, or extensions of time. Best practice is to include notes under a comprehensive table to explain or justify changes to the schedule.
In summary, this section should include:
- Milestones Completed
- Milestones Coming Up
- Foreseen Delays
- Notice of Delays
- Extensions of Time
Below is an example of schedule reporting from an older report template.
Authority Approvals
This is a short section, but detail any authority-related items that affect the project such as statutory approvals and utilities. These authorities should be identified and consulted early to avoid delays. Think of things like water or electrical utilities, councils, municipalities, governments or other groups that need consulting.
Community Engagement & Stakeholder Communications
If your project affects the folks living nearby, include a Community Engagement & Stakeholder Communications section in your report. This section is important because it shows that your project cares about the people and organizations it affects. It's about building trust, being transparent, and working together.
Community Engagement should cover:
- Keeping the neighbors in the loop: How are you letting the community know about the project and what it means for them?
- Listening to the community: What feedback have you received? Any major concerns?
- Getting involved: What have you done to connect with the community – like meetings, newsletters, or talking to the local paper?
By keeping the community informed and listnening to their feedback, you can proactively address their concerns and take steps to minimize any negative impacts of the project. It also allows you to build support by getting the community on board and excited about the project. That way, your project leaves a positive legacy in the neighborhood.
On the other hand, Stakeholder Communications is all about keeping everyone involved in the project updated. This includes any important people or organizations who have a stake in the project's success. Share any conversations you've had with them, including design feedback or approvals.
By keeping stakeholders in the loop, you can:
- Get valuable input: Gather feedback that helps you make better decisions.
- Ensure alignment: Make sure everyone is working towards the same goals.
- Build strong relationships: Foster trust and collaboration that benefit the project.
This section demonstrates your commitment to being a responsible and collaborative partner in the community.
Appendicies
Often, a PCG report requires appendices to provide additional, in-depth information that supports the main body of the report. Also, it serves as a record for historical purposes. Consider these appendices to ensure that stakeholders have access to all relevant data and insights for informed decision-making and drill down.
- APPENDIX A – Risk Register
- APPENDIX B – Previous Meeting Minutes
- APPENDIX C – RFI Register
- APPENDIX D – Schedule
- APPENDIX E – Cash Flow
- APPENDIX F – Budget Report
- APPENDIX G – Variations Register
- APPENDIX H – Stakeholder Register
- APPENDIX I – Contractor Report

Other Information to Include in Your PCG Report
Sometimes, you'll want to include some extra info in your PCG report called Key Performance Indicators (KPIs). Think of these as your project's scorecard – they measure how well you're doing over time. You set your KPIs at the beginning of the project, so you have something to compare your progress to. This helps you see if you're on track with your budget, schedule, resources, and overall plan.
By keeping an eye on your KPIs, you can spot trends and make quick decisions if things aren't going as planned. Here are some common KPIs you might want to include:
- Schedule Progress vs Plan: Difference between planned and actual progress in project timeline.
- Cost vs Budget: Difference between budget and actual project costs.
- Planned Value (PV): Budgeted cost of work scheduled.
- Earned Value (EV): Budgeted cost of work performed.
- Actual Cost (AC): Actual costs incurred for completed work.
- Cost Performance Index (CPI): Ratio of earned value to actual costs, indicating cost efficiency.
- Schedule Performance Index (SPI): Ratio of earned value to planned value, indicating schedule efficiency.
- Scope vs Plan: e.g. things like number of change orders issued during the project.
- Safety Incidents: Number of safety incidents or near misses reported.
- Cash Flow: Net cash inflow or outflow over a specific period.
Who reads a PCG Report?
A PCG report is typically distributed to all stakeholders in a construction project and the Project Control Group. PCG members, who also attend the PCG Meeting, generally include:
- Project Owners: The individuals or entities the construction project is for.
- Client-side project managers: Appointed by the Project Owner to manage the project.
- General Contractors: The construction company appointed during construction phases.
- Design Consultants: Architects, engineers, etc.
- Project Sponsor: Often a role from the Project Owner, who is funding the project.
- Other stakeholders/end users: Various other parties with an interest in the project.
Reading a PCG Report or attending a PCG Meeting, you can expect updates on all aspects of the project, including milestones, design decisions, budget reviews, risk analysis, and open dialogue on challenges or ways to optimize the project's path forward. It should also highlight key performance indicators (KPIs) that help everyone involved in the project to track its progress.
PCG Report Templates & Writing
Writing a PCG Report can be challenging! It requires gathering all necessary data from teams, systems, or stakeholders before you can begin. Isn't it easier if there is a PCG Report Template? Absolutely! 😁 We will walk you through that in this article. Please note, there is no 'perfect' template or format for writing a PCG Report. Any template will need to be adapted depending on your project or client. Knowing your target audience alone can make an enormous difference in writing an effective PCG Report.
The key 🔑 to writing an effective PCG report is to include vital details about the project's progress without overdoing it. Writing too many words can be counterproductive and overwhelming for stakeholders to read. It is always best to write concisely—straight to the point without missing any detail.
Effective Tools for Creating PCG Reports
Tired of spending hours on PCG reports? Frustrated with juggling multiple tools and data sources? There's a better way!
Look for a tool that:
- Eliminates manual data entry: No more copying and pasting between spreadsheets and reports. Enter data once, and it's automatically updated everywhere.
- Automates report creation: Say goodbye to hours spent formatting charts and graphs. The tool generates them for you.
- Ensures accuracy and consistency: No more worrying about typos or inconsistencies in your data. The tool keeps everything in sync.
- Simplifies report delivery: Generate professional-looking PDFs with a single click.
- Provides insights over time: Track your project's performance and identify trends with historical data.
Tools like Mastt are designed to solve these pain points. They give you a single platform for managing your project data and creating reports, so you can focus on what really matters – delivering successful projects.
How Mastt can help with PCG Reports
👉 Head to Mastt's Reporting Module or download our free PCG Report Template.
.avif)
Written by
Doug Vincent
Doug Vincent is the co-founder and CEO of Mastt, the AI capital-project management platform used by governments, Fortune 500 companies, and consultancies across APAC, North America, and MENA. Before founding Mastt in 2019, he spent a decade at RPS delivering more than $2 billion in capital works, including the $2.1B Defence Navy Infrastructure program, and holds a CPSPM certification with the AIPM. He contributes content and speaks on AI in capital project delivery at Mastt.


Contributions by

PCG Report Template
The PCG Report provides a comprehensive overview of the progress, status, and performance of a capital project on a monthly basis

Walk Into Every Meeting With Confidence, Clarity, and Control
No one wants to look unprepared, blindsided, or uncertain in front of stakeholders — but that’s exactly what happens without Mastt.
Start for FreeTrusted by the bold, the brave, and the brilliant across governments, Fortune 500s, and the world’s best in delivering the future