



Location-based scheduling organizes construction around physical areas, such as floors, zones, rooms, or segments. It shows where each crew should work and when it should move to the next location. This article explains how to build a location-based schedule, coordinate it with other methods, and control progress on site.
What is Location-Based Scheduling in Construction?
Location-based scheduling is a project scheduling method that assigns work to defined project areas. It also plans how crews progress through those areas. Work is divided into location-specific packages with planned quantities, resources, and durations.
These areas form a hierarchy called the location breakdown structure (LBS). A residential project, for example, may be divided into buildings, floors, apartments, and rooms. Teams can schedule crews at one level while tracking quantities and progress at a finer level.
This article focuses on the scheduling approach used in the broader Location-Based Management System, or LBMS. The broader system also uses location data for progress measurement, forecasting, and production control. This gives project management teams a clearer view of performance by location.

Location-Based Scheduling vs. Activity-Based Scheduling
Activity-based scheduling models the project as individual activities linked by dependencies. Location-based scheduling groups related activities into production tasks that move through physical locations. LBMS retains critical path method logic while adding quantities, resources, and crew continuity across locations.
Here are the main differences between the two methods:
An activity-based schedule can include location codes, resource loading, and detailed logic. However, its standard Gantt chart or CPM view still makes continuous crew flow difficult to read.
A location-based view exposes that flow directly, especially when several trades repeat work across floors or sections. In Mastt’s interview, Olli Seppänen describes the need for practical schedules that help site managers direct crews and plan resources.
Common Uses of Location-Based Scheduling
Location-based scheduling techniques are useful when crews move through a defined sequence of physical areas. The work does not need to repeat exactly in every location.
Common uses of location-based scheduling include:
- Multifamily and high-rise projects use floors, apartments, or zones to coordinate structural work, building services, and finishes.
- Hotels and repeated fit-outs use rooms or groups of rooms to plan handoffs between specialist trades.
- Hospitals and complex buildings use wings, floors, departments, or rooms to manage dense trade sequences.
- Roads, railways, tunnels, and pipelines use sections or chainage ranges to coordinate crews progressing along a route.
- Large or less repetitive projects use broad zones or apply location-based scheduling only to phases with clear spatial flow.
When introducing location-based scheduling, start with the project phase that has the clearest sequence and most reliable quantities. Expand its use after the team has tested the location sizes, production rates, and handover rules.
How Does the Location-Based Scheduling Method Work?
The location-based planning method coordinates work sequencing and production rates across physical locations. Planners use location quantities and expected crew output to calculate each task’s duration. They then sequence the trades so each location is ready before the next crew enters.
- Calculate duration by location: Planners divide the work quantity by the expected crew production rate. This gives the planned duration for each area.
- Sequence the trades: Activities follow the required construction order through each location. Crew capacity and start dates are adjusted to maintain planned buffers between trades.
- Plot the production flow: A flowline chart places time horizontally and locations vertically. Each line shows an activity’s progress, while its slope represents the production rate.
- Update actual progress: Teams record actual starts, finishes, and completed quantities by location. These updates help forecast how delays may affect following crews.
Location-level handoffs connect the production plan to the overall project schedule. In his apartment-building example, Seppänen explains how smaller work areas can distribute crew activity more evenly throughout construction.
Location-Based Schedule Example
This location-based schedule example shows five activities moving through four zones on two stories. Time runs across the top, while project locations appear on the left.

The chart shows production tasks overlapping because crews can work in separate zones at the same time. The horizontal curing line represents required waiting time rather than crew movement.
How to Read a Location-Based Schedule?
Read a location-based schedule by matching a work area with a date, then following the activity lines through the chart. Each line shows where an activity should be and when it should move to the next location.
- Check the axes: The timeline axis runs from left to right. The location axis lists floors, zones, or other work areas. Match a location row with a date column to find what work is planned there.
- Select a location: Choose one row and read it from left to right. The order in which lines pass through the row shows the planned activity sequence. The gaps show the time between crew handoffs.
- Trace an activity: Use the legend to identify an activity line. Follow that line through the chart to see where the crew starts and when it changes locations.
- Read the line shape: A diagonal line shows the activity moving through locations. A steeper line means faster movement when locations are similar. A horizontal section shows time passing without movement to another location. Check the legend to distinguish ongoing work, a planned wait, or an interruption.
- Compare the spacing: Parallel lines keep the same time gap between the events they represent. Check whether the chart plots starts, finishes, or both. Converging lines show that the following crew is catching up. Crossing lines flag a potential sequence or space conflict. Check task durations and dependencies to determine whether the overlap is a problem.
In the example, start at Story 1, Zone 2 and read across the row. Formwork arrives first, followed by rebar, MEP embeds, concrete placement, and curing. Following each line upward shows when the activity moves into later zones.
How to Create a Location-Based Schedule?
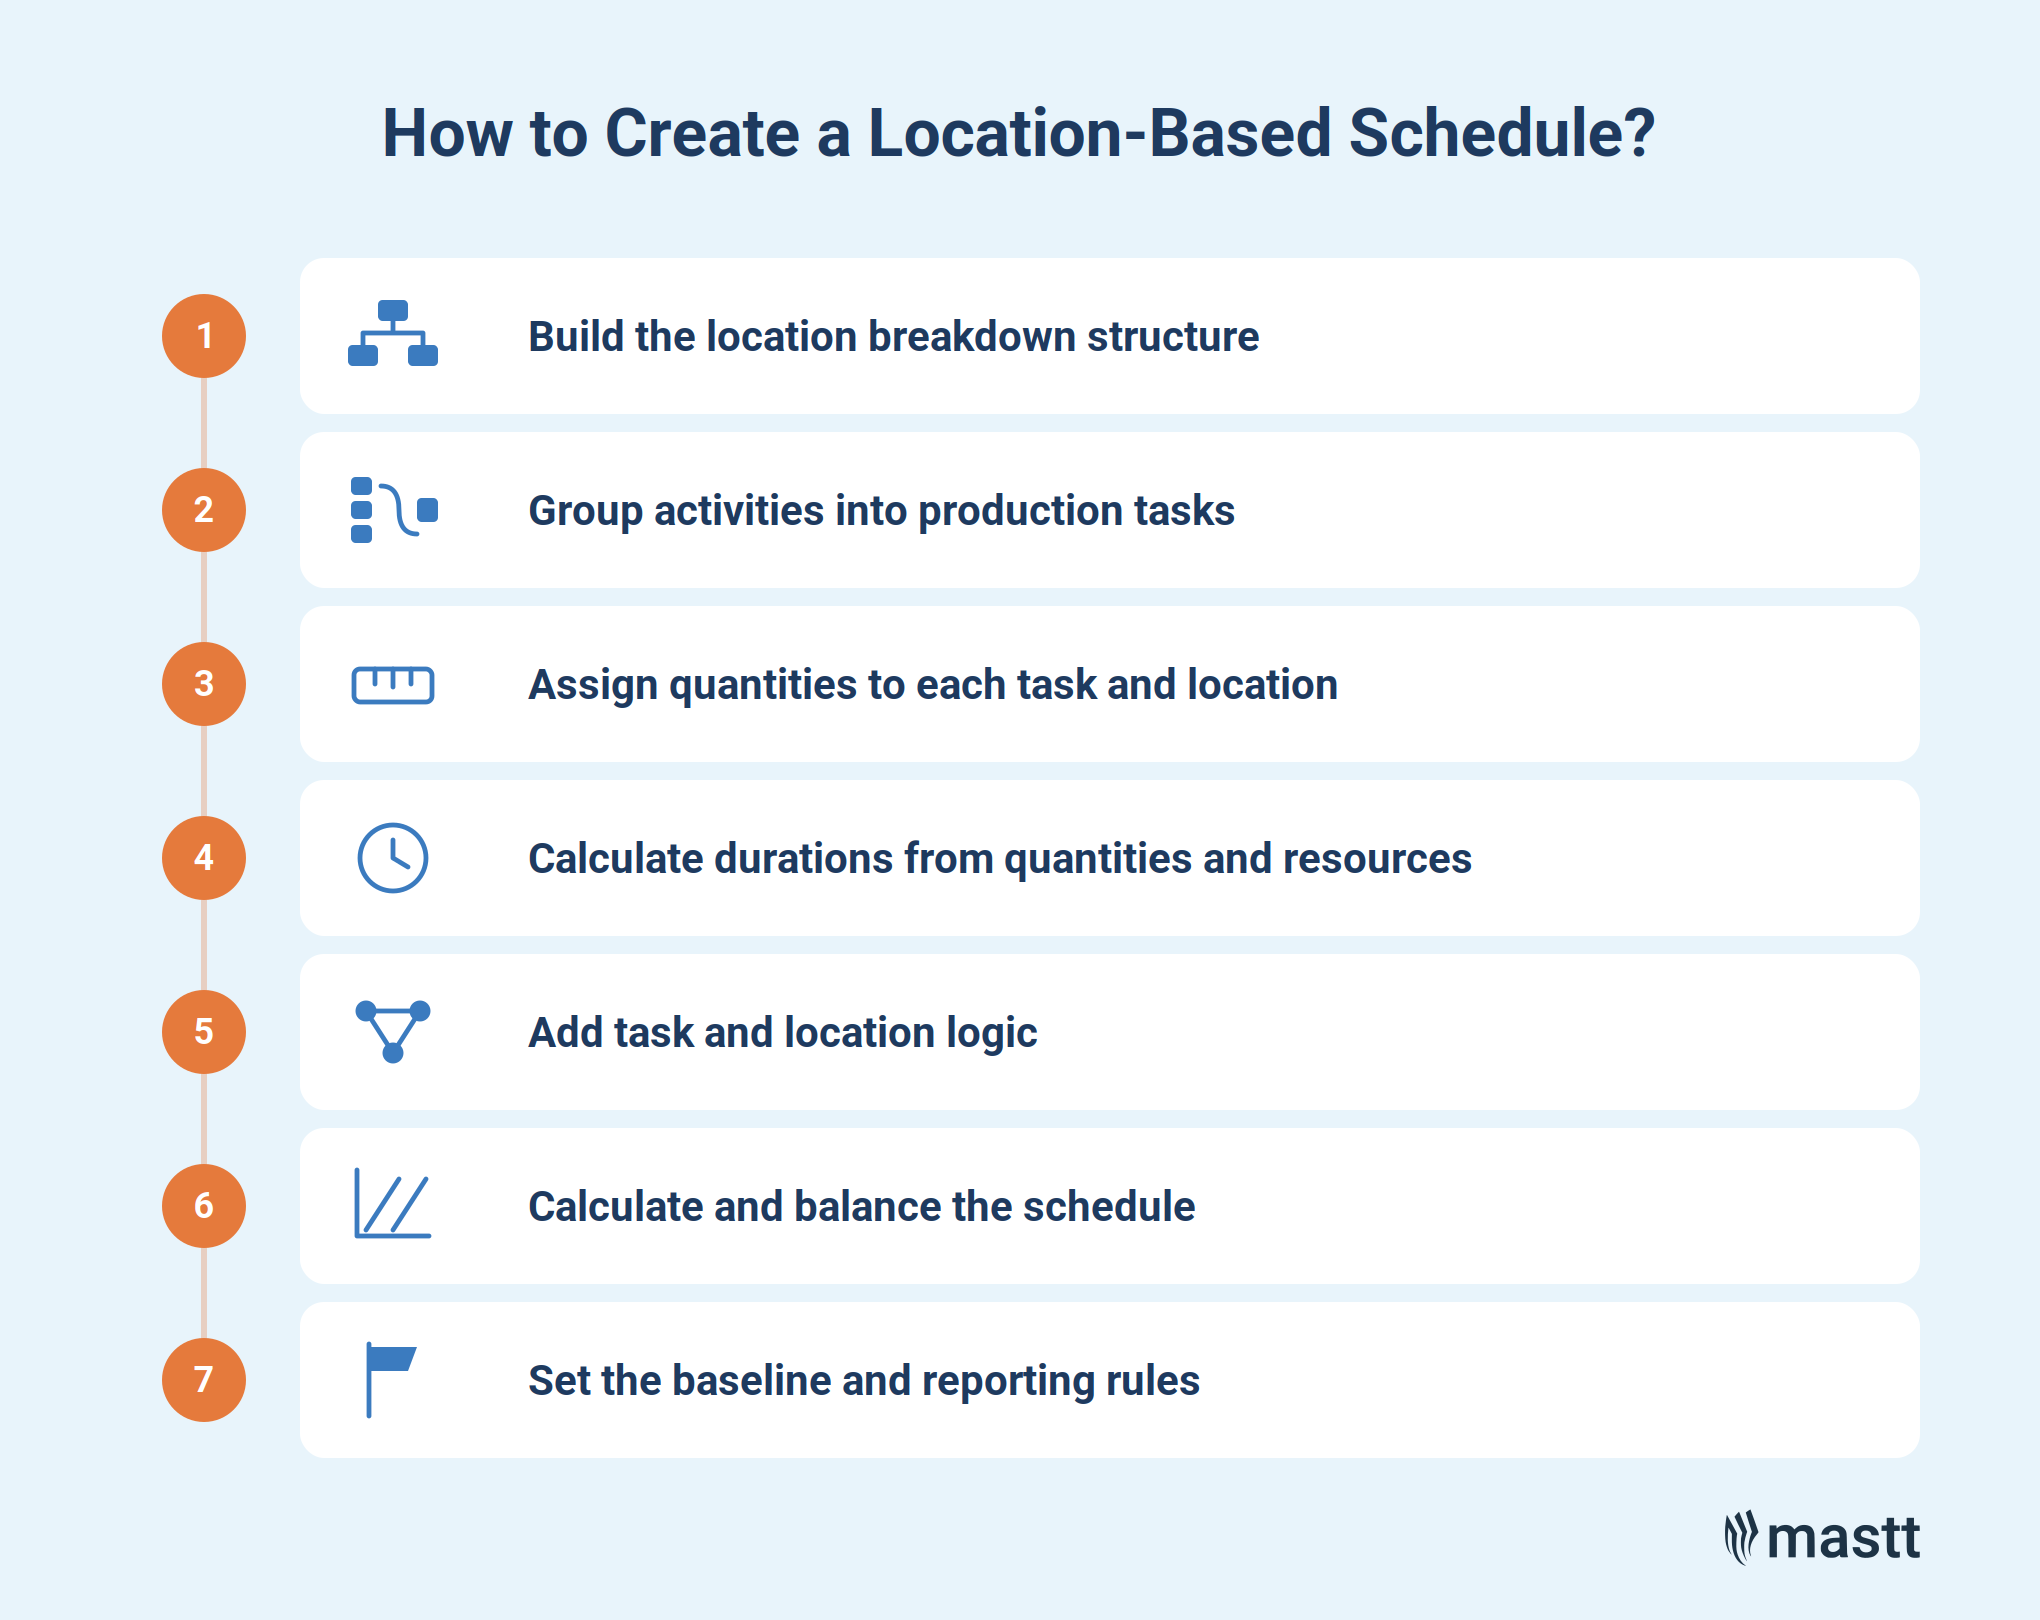
Create the schedule by connecting project locations, work quantities, crew resources, calendars, and task logic. Calculate each task’s movement through the locations, then adjust the plan to maintain workable handoffs and crew continuity.
Step 1: Build the location breakdown structure
Start by defining the location levels the team will use for planning, quantity allocation, and progress reporting. Set clear boundaries so teams can measure completion and confirm each handover consistently.
Different tasks can use different levels of the same structure. Structural work may move by floor, while finishes move by apartment or room. Keep the hierarchy consistent so quantities, schedule data, costs, and progress refer to the same locations.
Smaller locations increase the planning and logistics burden. For teams introducing takt production, Olli Seppänen suggests starting with floor-level locations and a one-week takt time. This is a starting example for suitable building work. Each project still needs quantity and resource checks before adopting that rhythm.
Step 2: Group activities into production tasks
Combine related activities that one crew or contractor will manage as a continuous package. A task represents that package moving through its assigned locations.
Group work according to how crews will perform it. Activities may form one task when the same crew can perform them as a continuous package. Separate drywall stages when MEP installation, inspections, or drying periods require the crew to return later.
A task does not need to exist in every location or contain equal quantities. LBMS can model work that changes between locations, provided each quantity belongs to a defined task and location.
Step 3: Assign quantities to each task and location
Prepare a bill of quantities that shows how much work each task contains in every location. Project totals alone cannot support location-level duration calculations.
Include every quantity item the crew must complete before handing over the location. For example, a drywall task may contain separate quantities for framing, board installation, insulation, and finishing. Each item can use its own labor consumption rate.
A standard bill of quantities template already separates work into items this way, so the remaining step is tagging each one to a location.
Step 4: Calculate durations from quantities and resources
For labor-driven work, convert each quantity into labor hours using a suitable consumption rate. Add those hours, then divide by the crew’s available labor hours per working day.
The basic calculation is:
Duration = Total labor hours ÷ Available crew labor hours per working day
This calculation estimates working time under the stated crew assumptions. Account separately for required waiting periods and equipment constraints. Adding workers may not increase output proportionally, especially in confined areas.
Define the crew composition and working calendar for each task. Use estimating data or past project results for the initial consumption rates. Adjust those rates when access, specifications, work methods, or site conditions differ from the source data.
Step 5: Add task and location logic
Define the task logic and activity dependencies that control which task must finish before another can start. LBMS applies repeated logic across locations, so planners do not need to create every relationship separately.
The logic can control several types of movement. It can link trades within the same location, set the order in which one task visits locations, or connect tasks across related locations. Standard CPM links can cover exceptions that do not follow the repeated sequence.
Keep required lags separate from buffers. A lag specifies a waiting period between linked activities, which may represent a technical requirement such as curing. A buffer provides usable space or time that can absorb normal production variation.
Step 6: Calculate and balance the schedule
Run the schedule calculations to determine when each task can start and finish in every location. Plot the results on a flowline or time-location chart, with time on one axis and locations on the other.
Balance the schedule by adjusting crew size, location sequence, task grouping, or start dates where the construction method allows. Split a task when one crew cannot maintain a practical flow through every location. Check that crews can maintain continuity and that any shared work areas provide enough space for compatible tasks.
Step 7: Set the baseline and reporting rules
Check the first and last location dates against the master schedule and project milestones. Save the approved schedule as the baseline. Define who will collect location-level progress data, how often updates will occur, and which records the team must provide.
Before work starts, document the quantities, labor consumption rates, crew assumptions, calendars, logic, and buffers behind the baseline. These records help the team determine whether a later delay came from site performance, changed scope, or an incorrect planning assumption.
How to Control a Location-Based Schedule During Construction?
Control the schedule by measuring actual work in each location, updating the forecast, and correcting problems before crews interfere. The LBMS method keeps the baseline, actual progress, and forecast separate so delays remain visible.
Seppänen’s research on location-based production control examines how teams respond when work departs from the plan. A location-based schedule rarely unfolds exactly as planned. Production control helps the team steer through deviations while protecting downstream flow.
The control cycle follows these steps:
- Record actual start and finish dates, completed quantities, labor hours, crew sizes, and work stoppages by location. Dates show whether work is late. Quantities and labor hours show whether the production rate has changed.
- Calculate the actual production rate and labor used per unit of work. Use those results to forecast the remaining duration in each location. Include any confirmed changes to crew resources in the forecast.
- Compare the forecast with the baseline schedule. Check whether crews will maintain continuous work, preserve their buffers, and meet key milestones. Pay close attention when a following trade begins catching the crew ahead.
- Respond to schedule alarms before interference occurs. An alarm may show that two trades will need the same location or that a crew will run out of available work. It may also warn that a delay will spread into later locations.
- Identify the cause before selecting a control action. Check whether the problem involves crew capacity, missing design information, materials, unfinished preceding work, or quality defects.
- Add the chosen action to the weekly plan and check the result at the next update. If the forecast still shows interference, revise the action while enough buffer remains.
Keep the baseline unchanged when routine schedule variance occurs so the original plan remains available for comparison. Use the project’s formal change process if approved scope or delivery changes require re-baselining.

How to Combine Location-Based Scheduling With Other Scheduling Methods?
Location-based scheduling can support master schedule and phase planning while sharing milestones with a contractual CPM schedule. Takt planning can provide a common production rhythm, while Last Planner and pull planning support collaborative phase, lookahead, and weekly planning.
The table shows how common scheduling methods can support the same project plan:
Keep milestone dates and the reporting date aligned across the planning systems. Map phase tasks to the relevant master milestones instead of forcing every planning level to use identical activities.
Project teams can use Mastt’s construction scheduling software to track milestone progress and report on schedules imported from Primavera P6 or Microsoft Project.
Make Location-Based Scheduling Work on Site
Location-based scheduling works best when each phase uses a consistent location structure for planning, progress reporting, and forecasting. Build the baseline from measured quantities and workable crew rates. Once construction begins, update the forecast regularly and resolve upcoming location conflicts before they interrupt production.
The expert insights in this article draw on Mastt’s interview with Olli Seppänen.
.avif)
Written by
Doug Vincent
Doug Vincent is the co-founder and CEO of Mastt, the AI capital-project management platform used by governments, Fortune 500 companies, and consultancies across APAC, North America, and MENA. Before founding Mastt in 2019, he spent a decade at RPS delivering more than $2 billion in capital works, including the $2.1B Defence Navy Infrastructure program, and holds a CPSPM certification with the AIPM. He contributes content and speaks on AI in capital project delivery at Mastt.


Contributions by
Olli Seppänen
Olli Seppänen is a tenured Associate Professor of Operations Management in Construction at Aalto University in Finland, and co-author of the foundational text on location-based management for construction. He co-founded the construction software company Vico Software, chairs the board of site-intelligence firm Aiforsite, and initiated the Aalto Building 2030 research consortium. At Mastt, he contributes content on construction productivity, lean, and digital delivery.
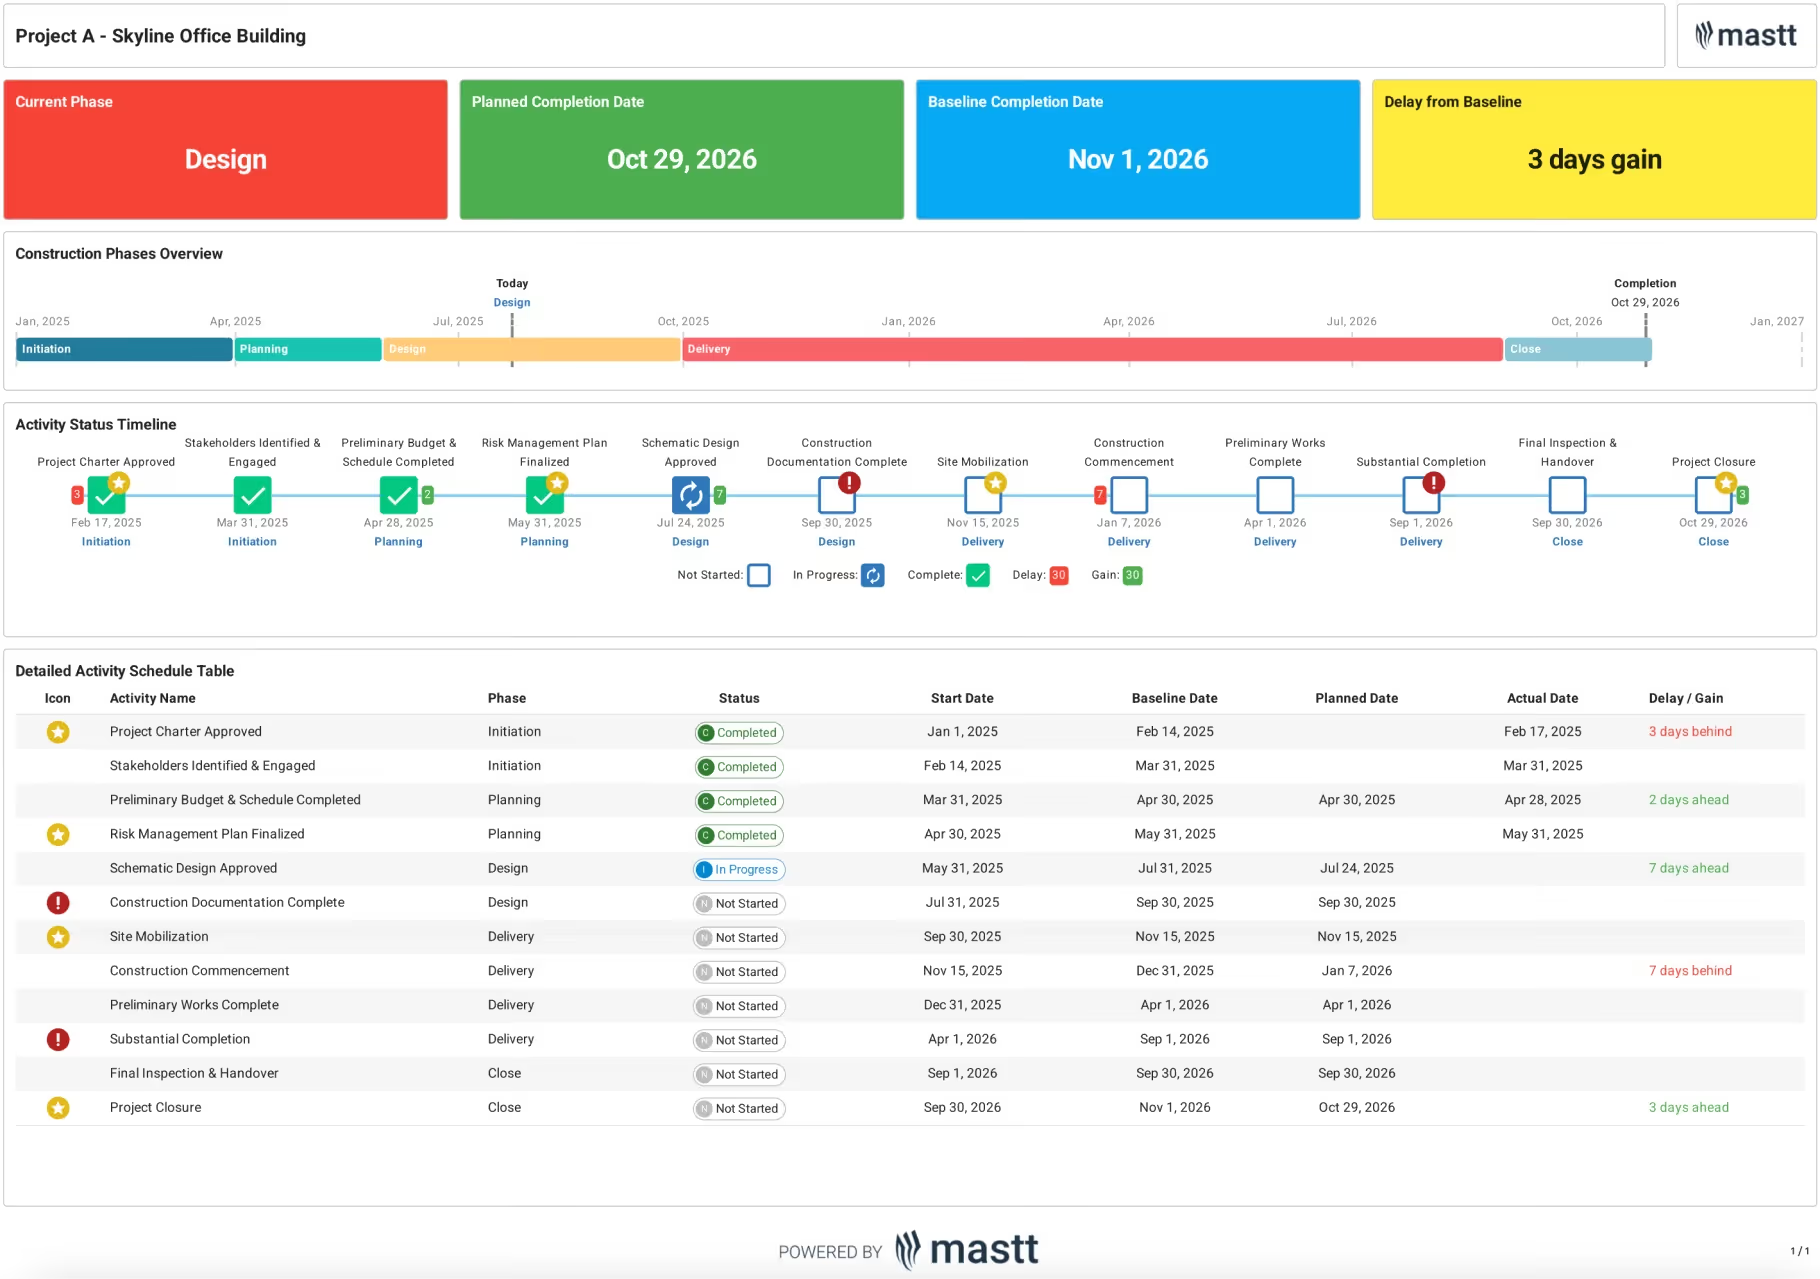
Construction Schedule Template
Use this FREE Construction Schedule Template to plan and outline all phases, milestones, and tasks. Keep your construction project organized and on track from start to finish.

Walk Into Every Meeting With Confidence, Clarity, and Control
No one wants to look unprepared, blindsided, or uncertain in front of stakeholders — but that’s exactly what happens without Mastt.
Start for FreeTrusted by the bold, the brave, and the brilliant across governments, Fortune 500s, and the world’s best in delivering the future