Post author:
Jackson Row
Contributor:
Timothy Mather.avif)
Reviewed by:
Doug Vincent
A complete owner-side guide to construction project scheduling. Methods, tools, best practices, and how to keep the schedule driving the field.

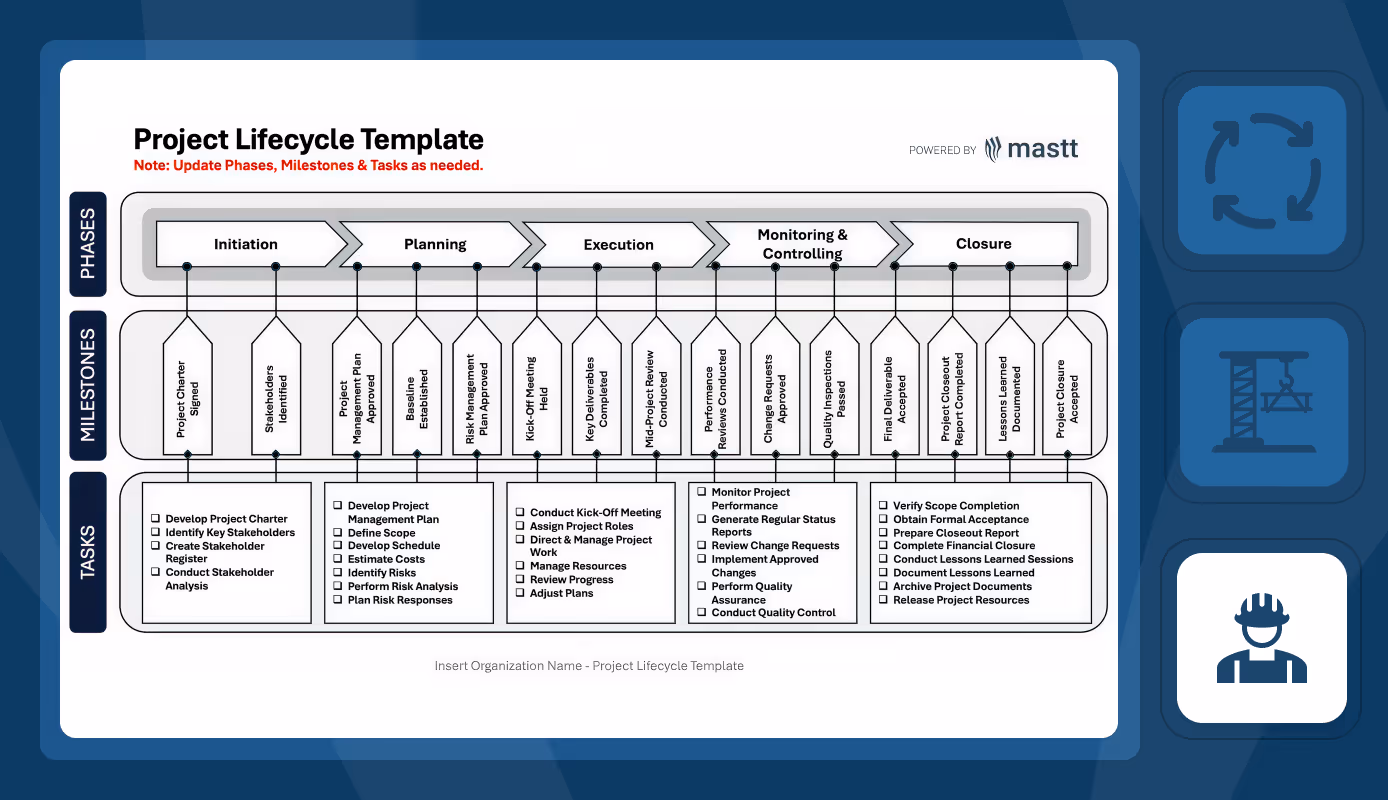
Free Schedule Management Plan Template! Outline how your project’s schedule will be managed, monitored, and controlled throughout the project lifecycle.
.avif)
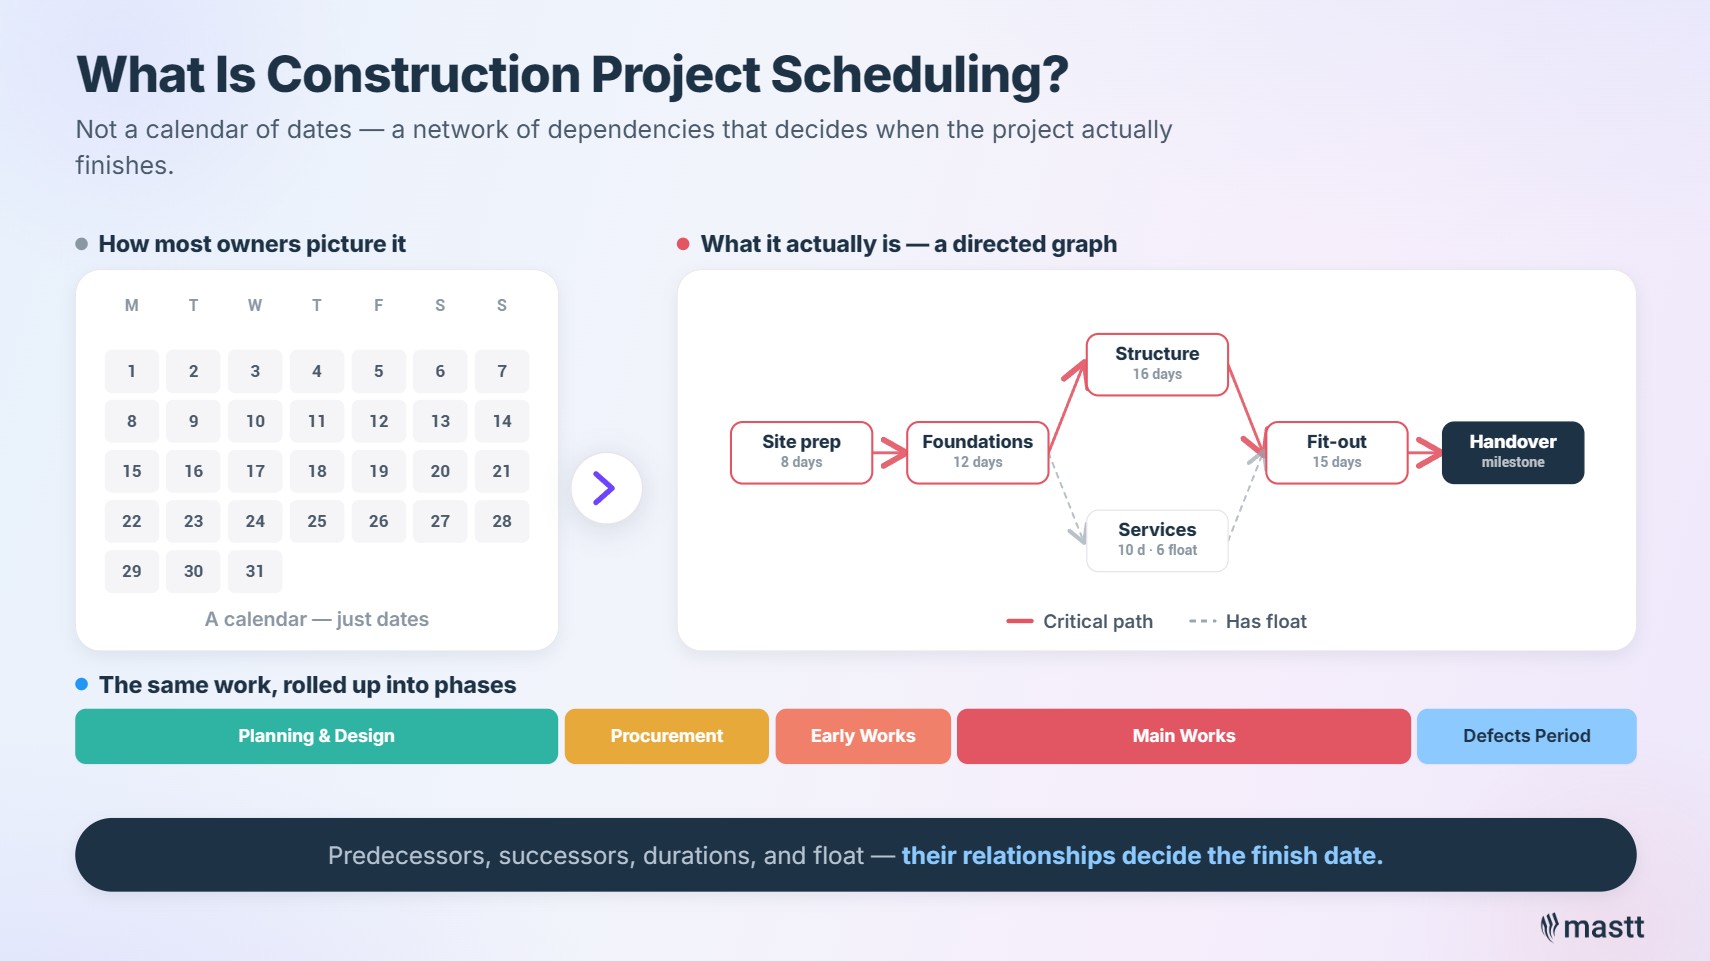
Construction project scheduling is how owners and project managers plan, sequence, and control the work so the build finishes on time. A useful schedule sequences activities, manages float, and keeps the office and the field aligned on what to build next.
This guide covers what construction project scheduling is, the phases and milestones a schedule models, and the methods used to build one. It also walks through how to put a schedule together, where it connects to cost, and how AI is changing the work.
Construction project scheduling is the process of planning every activity needed to deliver a build. It sequences activities with logical dependencies, assigns realistic durations, and connects them through milestones. The resulting construction schedule is the living document that links contract milestones, resource plans, procurement lead times, and field execution into one network.
Most owners treat the schedule as a calendar. A better mental model is a directed graph. Every activity has predecessors, successors, durations, and float, and the relationships between those four properties determine when the project actually finishes.
A working construction schedule sits at the intersection of scope, time, and resources. Scope tells you what has to happen, time tells you when, and resources tell you whether either is realistic. When any of these is wrong, the schedule starts to drift from the field.
Construction project scheduling matters because every day of delay costs an owner money. The cost shows up in extended general conditions, finance charges, and lost revenue. The schedule gives an owner control over those costs by sequencing work, identifying the critical path, and flagging emerging risk before recovery is needed.
Industry research from McKinsey & Company has documented a long-running productivity gap in construction. Unreliable scheduling sits at the center of the cost overruns and missed handover dates that gap produces.
A reliable construction schedule protects three things for an owner, each showing up in the project's profit and loss in a different way. Time-to-revenue protects the income side. Cost certainty protects the expense side. Risk position protects the contingency.
That last one is where the conversation gets uncomfortable.
"The bent of a lot of the CPM programs that I have seen has to do with litigations and claims, the ability to defend your position on a critical path network if there are claims after the project. And that seems like a pretty negative way to spend your energy."
- Timothy Mather
When the schedule is built to defend a position rather than deliver the project, it still costs the owner money. The cost just shows up in a different line item.

A construction project moves through five recognized phases. Each phase has a different scheduling requirement:
Each phase carries a different scheduling weight. Initiation and planning produce the baseline. Execution is where the schedule's value gets made or lost. Closeout is routinely under-planned, which is one reason projects miss their final completion date.
Most owners run a layered plan that gets denser as the work approaches, because the schedule that worked at initiation rarely survives execution untouched.
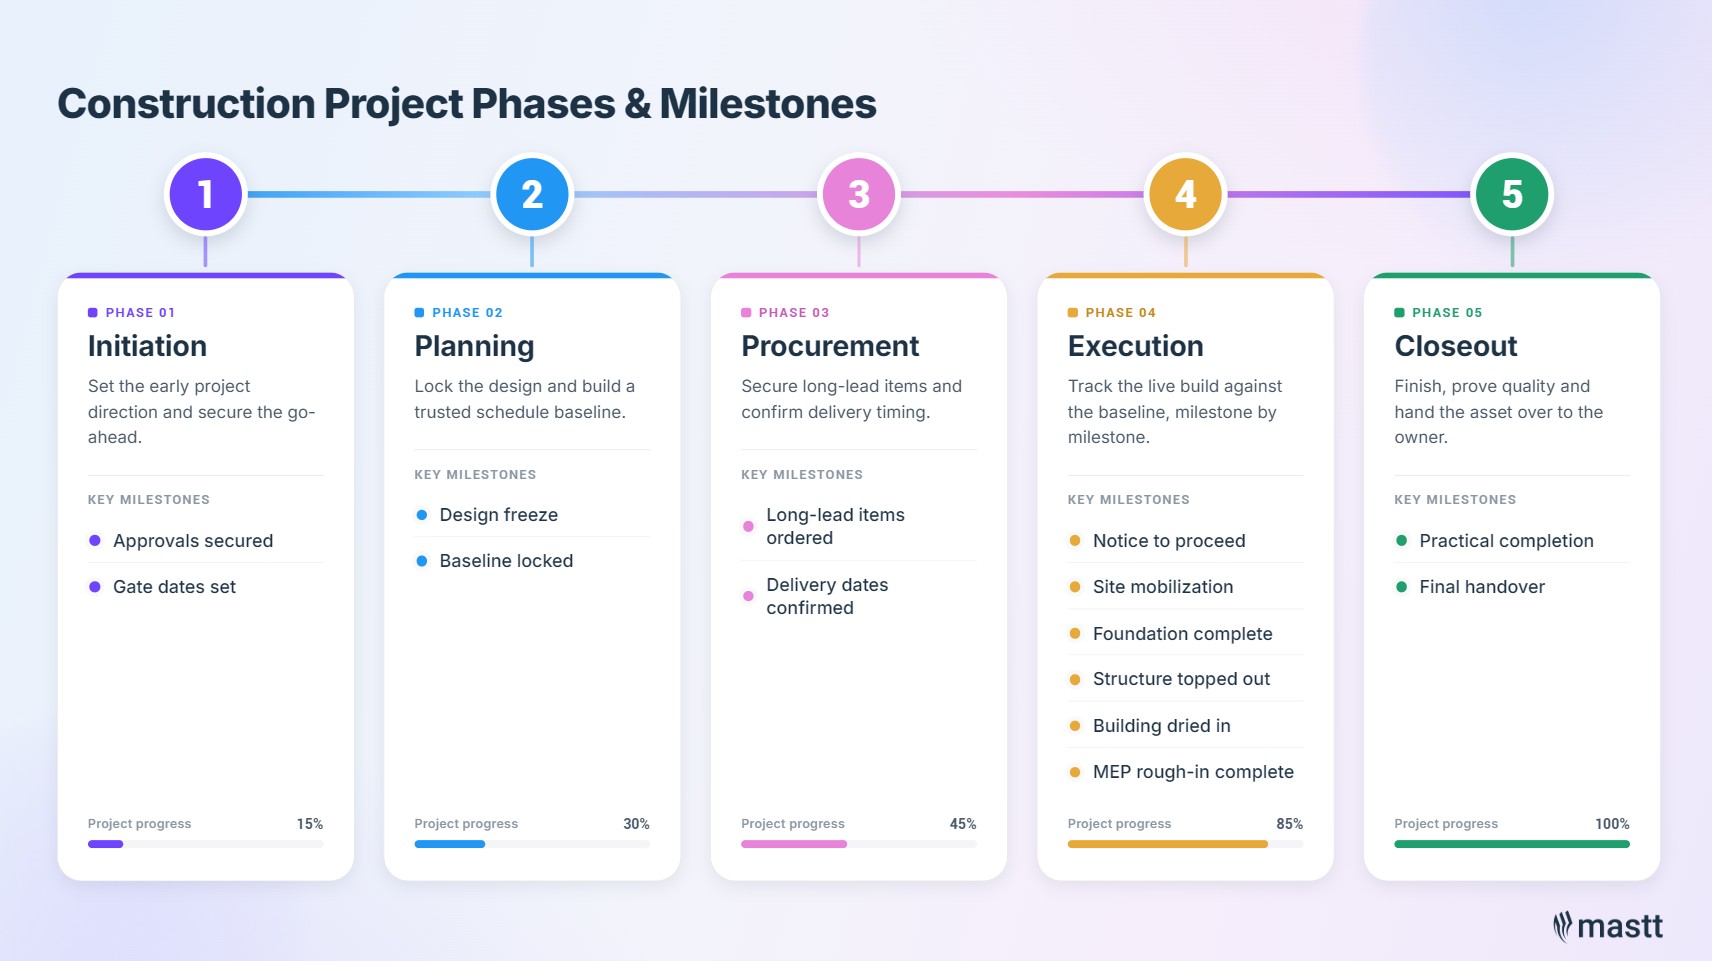
Construction projects also share a recurring set of milestones an owner should be able to point to on any schedule. Each one is a decision point as much as a date such as:
Each milestone needs specific data, sign-offs, or deliverables sitting behind it. Without those, the milestone is a flag on a chart, not a decision point.
A construction schedule is built from five components: a work breakdown structure, activities, dependencies, durations, and milestones. A weak link in any of the five tends to fail the schedule in predictable ways.
The five core components:
Beyond these five, a working schedule needs a schedule baseline (the approved version you measure against), a WBS dictionary (definitions for each work package), and clear written ownership of every activity.
A construction project uses several schedule types in parallel, each at a different level of detail and serving a different audience:

The five types are meant to be views of the same underlying data, not separate documents that need reconciling. When they drift apart, the master schedule and the look-ahead start describing different projects. The weekly update cycle then becomes reconciliation work rather than decision work.
Owners who treat the master schedule as the only one that matters lose touch with what crews are doing on site. Owners who only watch the look-ahead lose the longer-range view. The skill is keeping them in sync.

Construction project scheduling methods fall into five main categories, each suited to a different project type, scale, and level of certainty. Most large projects use two or three of them in combination.
Most construction project scheduling tools render these methods as Gantt charts on screen. A Gantt chart is the presentation layer rather than the method itself, showing activities as horizontal bars on a timeline with dependencies drawn between them. Primavera P6, Microsoft Project, and almost every other scheduling tool default to the Gantt view, even when the underlying logic is CPM or GPM.
The critical path method is the industry default. It underpins Primavera P6, Microsoft Project, and most other enterprise tools. NetPoint, the GPM implementation built by PMA Technologies, sits in a separate category as a planning-first canvas. Linear scheduling is the standard for repetitive infrastructure work.
Lean construction teams also use the Last Planner System. This pull-planning method, developed by the Lean Construction Institute, is most effective when paired with CPM. CPM holds the network logic; the Last Planner System drives the weekly commitments.
CPM does not scale gracefully on long programs.
"If you have a five-year program with 30,000 activities in it, you are making it up. You do not know that three years from now this I-beam is going to get bolted to that piece of concrete. It is just not true."
- Timothy Mather
Right-size the activity count to the certainty you actually have, not the certainty you want. A schedule with more activities than the team can update on a single cycle stops being a plan and becomes a record-keeping exercise. Rolling wave principles work well for anything past eighteen months out, with detail brought forward as crews approach each activity.
Construction scheduling tools fall into three categories based on who uses them and the job they do on a project. Most owners deal with all three at some point during delivery.
The three categories sit at different points in the schedule's life:
Two adjacent categories are worth knowing. 4D BIM platforms like Synchro and Navisworks link the schedule to the 3D model. Sequence clashes show up before they hit the field. AI-layered tools are the newer category and are covered in the AI section below.
For project owners, the choice usually is not which CPM tool the contractor uses. It is which platform makes the schedule readable, defensible, and connected to cost and risk for the owner-side team.
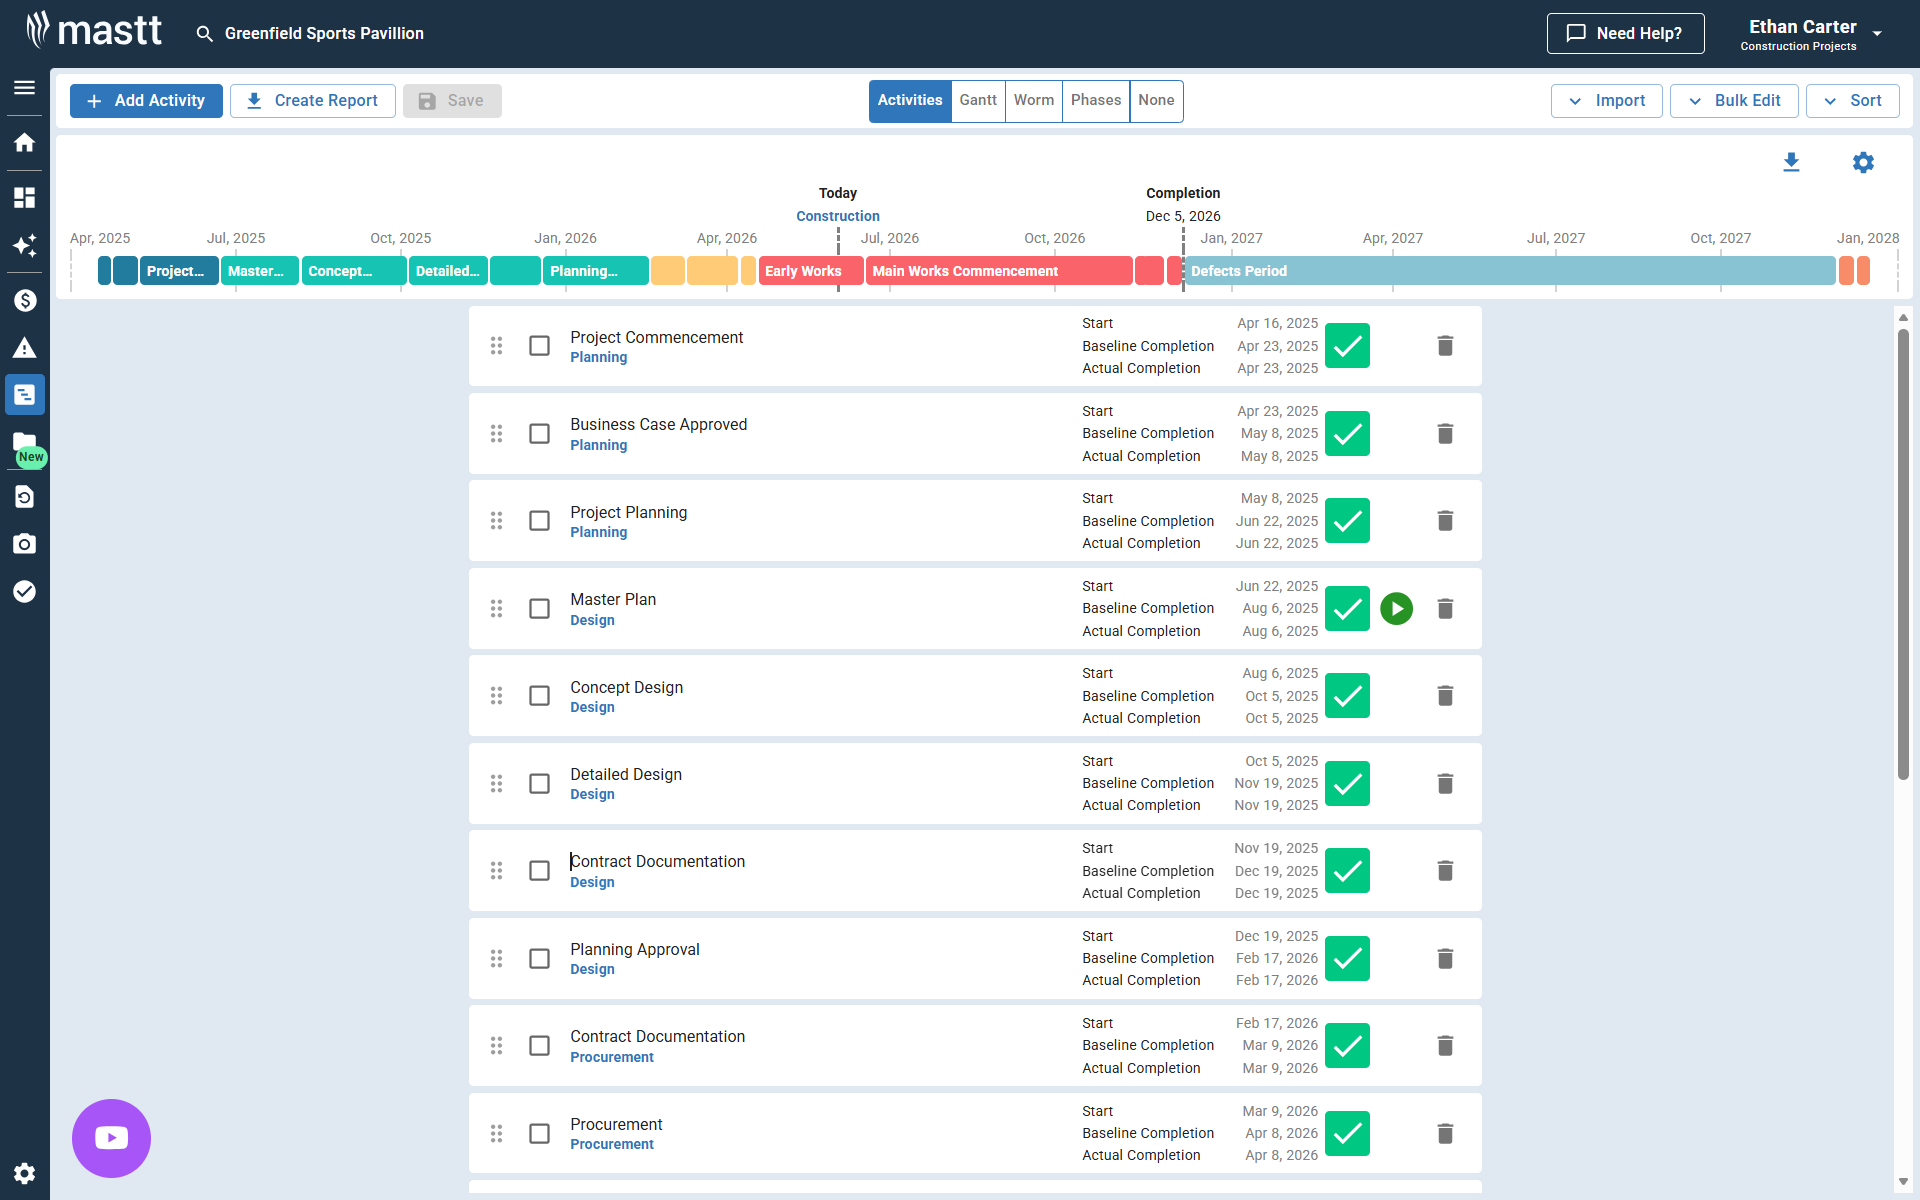
Mastt's construction project scheduling software imports P6 and MS Project files directly. The schedule the contractor builds becomes the schedule the owner reads in context.
Creating a construction schedule follows six core steps: define the scope, build the WBS, identify activities, set durations, sequence the work, and baseline the result. Skipping any step produces a schedule that will not survive the first month of execution.
Scope definition starts with the contract, the design drawings, and the project execution plan. Every activity in the schedule must trace back to something in scope. Anything outside scope belongs in a change-order register, not in the schedule.
Decompose the project into work packages, then break each work package into deliverables and activities. Use the same WBS the cost team uses, so cost and schedule remain reconcilable.
A WBS that lives inside dedicated construction scheduling software stays consistent with the activity network and the look-ahead it feeds. That removes the manual rebuilding most teams do when the WBS, the master schedule, and the field plan all live in separate files.
For each work package, list every activity needed to deliver it. Assign each activity a unique ID, a clear description, and an owner. "Install MEP services on level 3" is not an activity. "Install electrical rough-in on level 3, north zone" is.
Use historical data, productivity rates, and crew sizing. Avoid round numbers across the board. Three-point estimating is worth the effort for any activity with material risk.
Connect activities using finish-to-start, start-to-start, finish-to-finish, or start-to-finish relationships. Add lead times and lag times only when they reflect real constraints. The result is the project network, which is what CPM and GPM tools operate on.
Lock the approved schedule as the baseline and protect it. Every formal update is a delta against the baseline. Without that version-control habit, the team cannot measure performance.
For a starting point, see the Mastt construction schedule template and the guide to developing a project schedule.
The critical path is the longest sequence of dependent activities in a construction schedule. It controls the project's finish date directly. Float is the time a non-critical activity can be delayed before it starts affecting the critical path. Managing float is how project managers absorb minor delays without losing the end date.
The critical path calculation runs a forward pass to compute earliest start and finish dates. A backward pass computes latest start and finish. Activities with zero float between those passes form the critical path.
The network underneath is usually drawn as an Activity-on-Node (AON) diagram, where each activity is a box and each dependency is an arrow between boxes. AON is the modern network diagram standard. Older Activity-on-Arrow (AOA) diagrams are rarely used today.
Two types of float matter day-to-day, and confusing them is a common scheduling error. Total float refers to the path; free float refers to the activity. Both are useful, but they answer different questions.
See the worked walkthrough in free float vs total float.
The risk most teams underestimate is float erosion on near-critical paths. A path with three days of float is one weather event from becoming critical. That is the structural reason behind the "death by a thousand cuts" pattern many delayed projects show.
Some scheduling problems do not fit the standard CPM model. Every experienced planner uses a small set of specialist tools to handle them. These tools also help an owner read a contractor's monthly schedule update properly.
For deeper detail see the Mastt hammock activity glossary entry and the time impact analysis blog. The recognized TIA methodology is set out in AACE International's Recommended Practice 52R-06, Prospective Time Impact Analysis as Applied in Construction.
Owners who can spot a fragnet inserted for advantage spot schedule problems weeks earlier. The same goes for a hammock activity used to report rather than drive work. Owners who rely only on percent-complete reporting see the problems later.
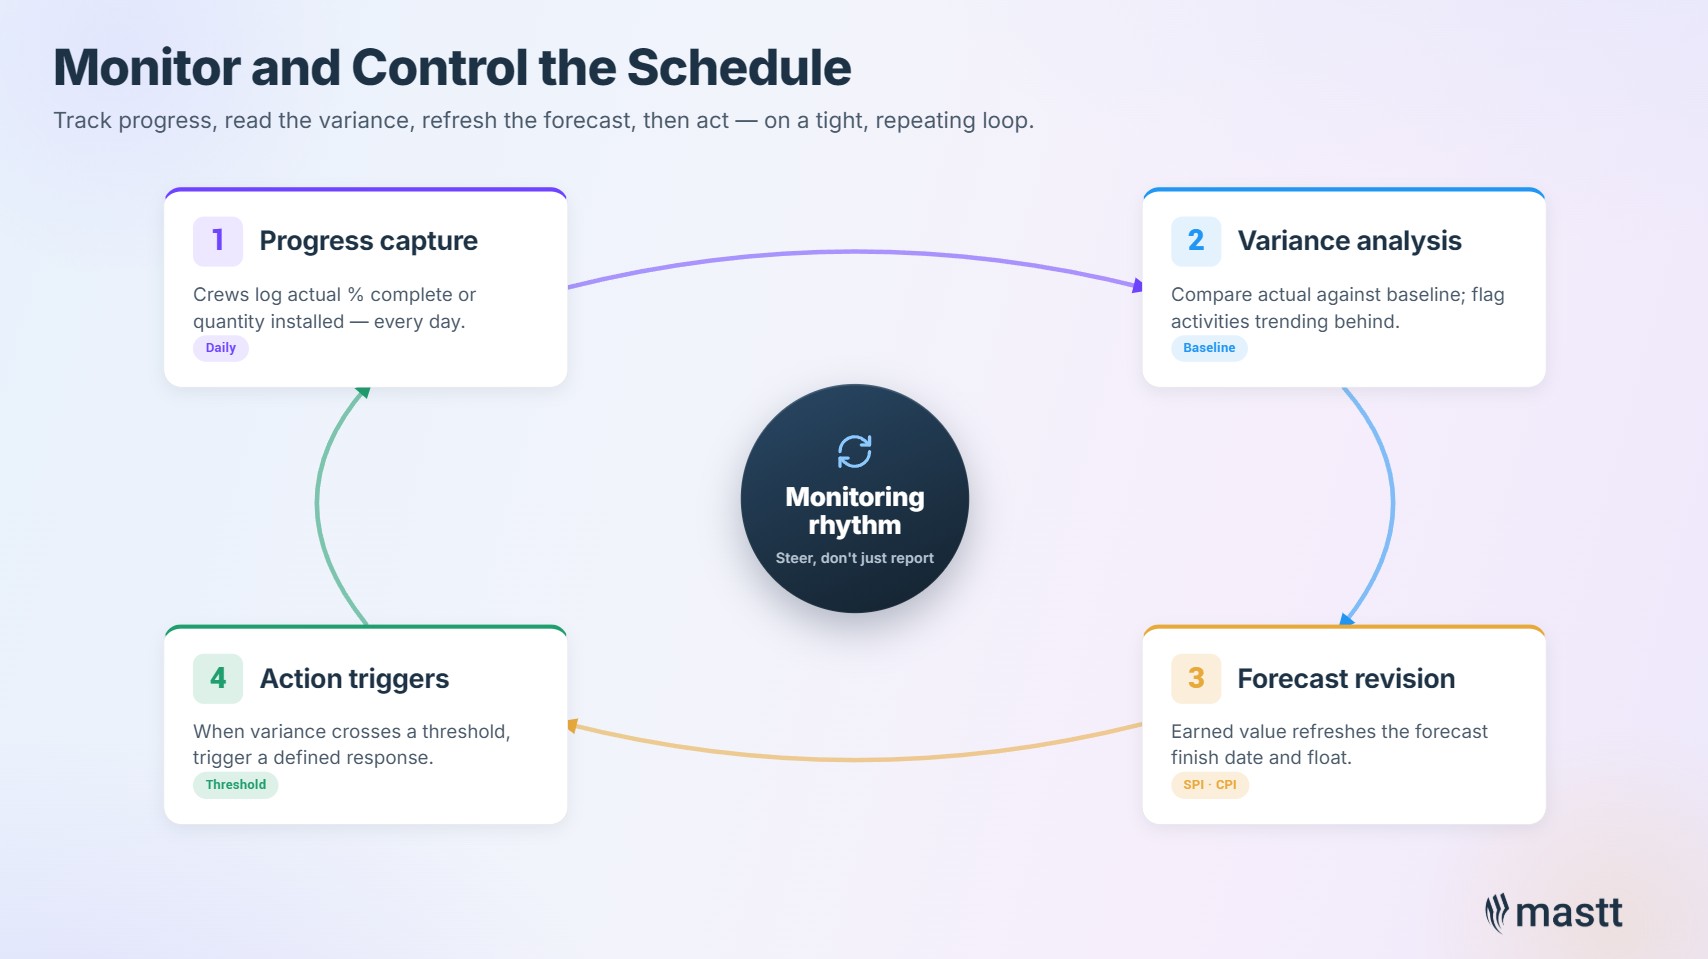
Monitoring a construction schedule means tracking actual progress against the baseline, identifying variance, and updating forecasts before issues compound. Control is what the project manager does with the variance. Most owners get into trouble when they treat the update cycle as reporting rather than steering.
The construction project scheduler owns the monitoring rhythm. On large projects this is a dedicated role; on smaller projects it falls to the project controls lead or the project manager. Either way, the work is the same.
An effective monitoring rhythm operates on four moving parts that work together. Skipping any one lets the schedule lag the project rather than steer it.
The four parts work as a system. Progress capture without variance analysis is data without insight. Variance analysis without action triggers is insight without consequence.
Earned Value Management (EVM) gives the monitoring rhythm its numbers. It is treated as a core knowledge area in the Project Management Institute's PMBOK Guide. EVM combines three core values into a small set of derived metrics:
From those, two derived metrics summarize project performance. The Schedule Performance Index (SPI = EV / PV) tells you whether the project is ahead or behind. The Cost Performance Index (CPI = EV / AC) tells you whether the budget is holding. An SPI of 0.85 means the project is earning 85 cents of planned work for every dollar planned. That is an early signal the schedule needs intervention.

The biggest risk in monitoring is letting the update cycle stretch too far. Once the master schedule no longer reflects the field, it has stopped steering the project. If updates happen every two weeks but crews make decisions every two hours, the gap is real.
"I see the field work and the schedule as running on two separate parallel paths. Even if you were to do an update bi-weekly, that 30,000 activity schedule is not actually driving work on the site."
- Timothy Mather
Tightening the update cycle is one of the highest-impact moves a project controls lead can make. Moving to a continuous-status model, where field data flows into the master in near-real-time, takes that one step further.
If the weekly review meeting is dominated by reconciling percent-complete numbers, the schedule has stopped steering and started reporting.
Construction schedules drift when the master schedule and the look-ahead operate on different cadences and pull from different data. The two documents stop describing the same project, and every formal update becomes reconciliation work.
"It just seems like Kabuki theater to me. You are trying to align reality when really you should have one consistent platform that is thought out and is accessible to everyone and actually drives the work."
- Timothy Mather
Three signals tell an owner the drift is serious:
Closing the drift is a tooling problem, a process problem, and a contract problem. The tooling fix is one shared platform. The process fix is making the look-ahead a view of the master. The contract fix is specifying which schedule is authoritative and how it gets updated.
Schedule risk is the probability that activities, paths, or the project as a whole will finish later than planned. It should be analyzed continuously, not only at stage gates. The standard quantitative method is Monte Carlo simulation, which runs thousands of schedule outcomes against probability distributions for each activity duration.
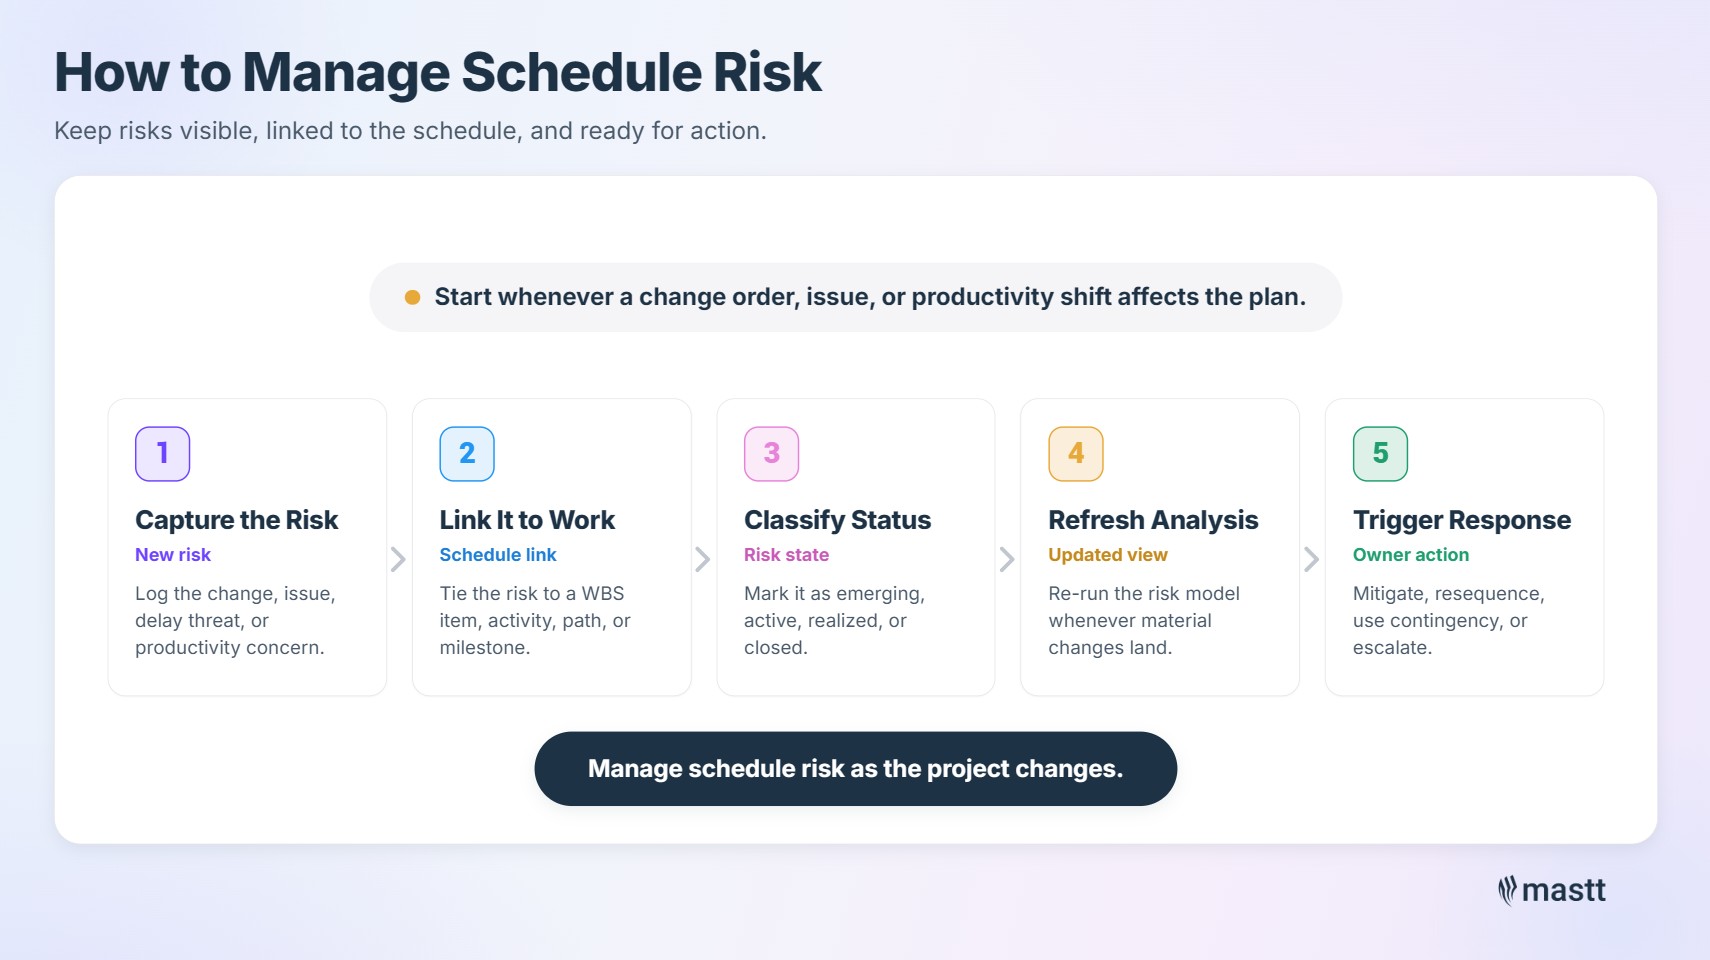
The traditional pattern is to risk-load the schedule once at the start, run a Monte Carlo, and reference the result at stage gates. That misses the point. Risk is dynamic. Every change order, every emerging issue, and every productivity shift moves the distribution.
"Risk should actually be a part of your project as it executes, not just at the beginning to get through a stage gate."
- Timothy Mather
A continuous model has four ingredients:
See the Mastt guides on schedule risk analysis and active risk management for the methodology in detail.
The cumulative-change problem is real. A project with a thousand small change orders can still finish late. None of the changes directly affects the critical path, but float keeps eroding on previously safe paths. Continuous analysis is what catches that.
For example, consider a 24-month build with 50 active paths. A hundred small change orders, averaging two days each, get absorbed across non-critical activities through the first six months.
Each individual change looks insignificant.
By month seven, the longest near-critical path has gone from 14 days of float at baseline to 3 days. Nothing has obviously broken, but the project is now one weather delay or one bad week from missing its handover date. A snapshot Monte Carlo at the gate review would have shown a comfortable margin. Continuous monitoring shows the erosion in real time.

When a construction project falls behind, the two recognized recovery techniques are fast tracking and crashing. Each has different cost, risk, and quality implications, and most real recoveries combine them with resequencing and scope reduction.
The four levers a recovery plan can pull:
The choice depends on cost tolerance, risk tolerance, and contract conditions. See the comparison in fast tracking vs crashing and the definition of project crashing.
The most important rule for recovery is to model it before committing. A recovery plan that gets the project back on date but blows the cost contingency is not a recovery. It is a different problem with a new name.
For example, consider a project four weeks behind on its critical path. Crashing structural work might recover three weeks at meaningful overtime cost. Fast-tracking MEP into the structural envelope might recover one more week at a smaller cost but with rework risk if the steel detailing changes.
The final week becomes a contractual extension request. Three levers, three cost profiles, and the modeling step is what shows which combination actually works for the owner.
AI is changing construction scheduling by removing the data-entry layer, enabling natural-language access to the schedule for non-experts, and running continuous trend analysis in the background. The agentic version of these capabilities is what changes the role of the scheduler.
The three highest-impact applications today are:
"The advent of AI within the world of scheduling is probably one of the biggest opportunities we have. The ability to build a data lake off a whole project and natural language query that project for answers is going to level the playing field for all the professionals who have questions."
- Timothy Mather
The scheduler's role does not disappear. It shifts. Less time on data entry and reconciliation, more time on judgment, logic, and the conversations that move the project forward. See the Mastt guides on AI in construction and AI agents in construction for the broader picture.
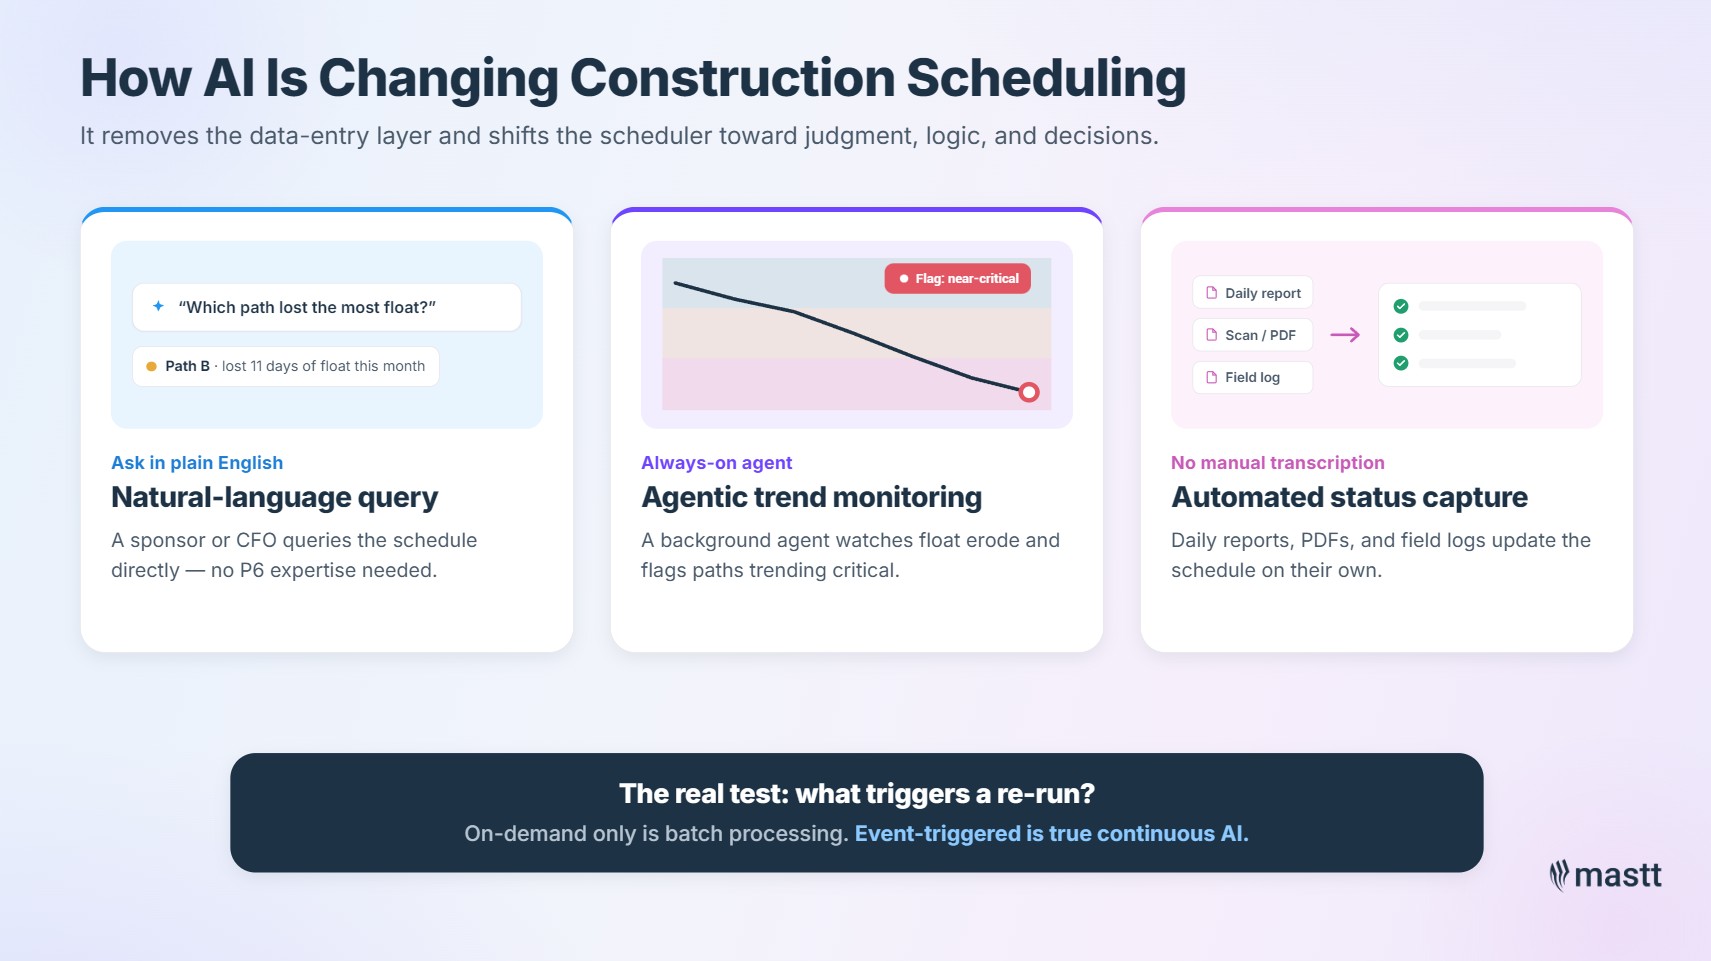
Beyond these three applications, 4D scheduling is becoming a useful visualization layer for owners reviewing complex builds. 4D scheduling integrates the schedule with the Building Information Modeling (BIM) model, so the schedule can be played back visually against the 3D design. Paired with agentic AI monitoring, 4D scheduling makes float erosion and resource clashes easier to spot.
When a vendor pitches AI for scheduling, a useful filter is to ask what triggers a re-run. If the answer is on demand only, the tool is faster batch processing dressed up as AI. True continuous analysis is event-triggered by material changes in the schedule or the risk register.

Construction scheduling connects to project cost at every milestone, every change order, and every variance. That is why most construction projects integrate the schedule and the cost system at the work-package level. Time is money on a construction project, and tracking them in separate systems guarantees they will tell different stories.
The integration mechanics are straightforward. The WBS is shared between schedule and cost. Earned value links the two; PV, EV, and AC combine schedule progress with cost performance. Change orders update both systems together so they cannot move out of sync.
When the schedule and the cost data sit in one platform, the integration is automatic. When they sit in two, every reconciliation cycle creates risk that one of them is wrong. For owners running multiple projects at once, integrated cost-and-schedule reporting is what makes portfolio-level visibility feasible at all.
Best practices in construction project scheduling come from owners and project controls leads. They know which decisions separate a schedule that drives delivery from one that just documents work.
Six practices that consistently separate reliable schedules from unreliable ones:
Adopting all six at once on a live project is unrealistic. Start with the meeting habit, then build the tooling and risk processes around it. Most owners who get visible value from their construction schedules trace it back to that single shift in how the weekly review is run.
The most common construction project scheduling mistakes are observable in any weekly project review. Each is preventable, none is rare, and each has a specific fix that does not require new software.
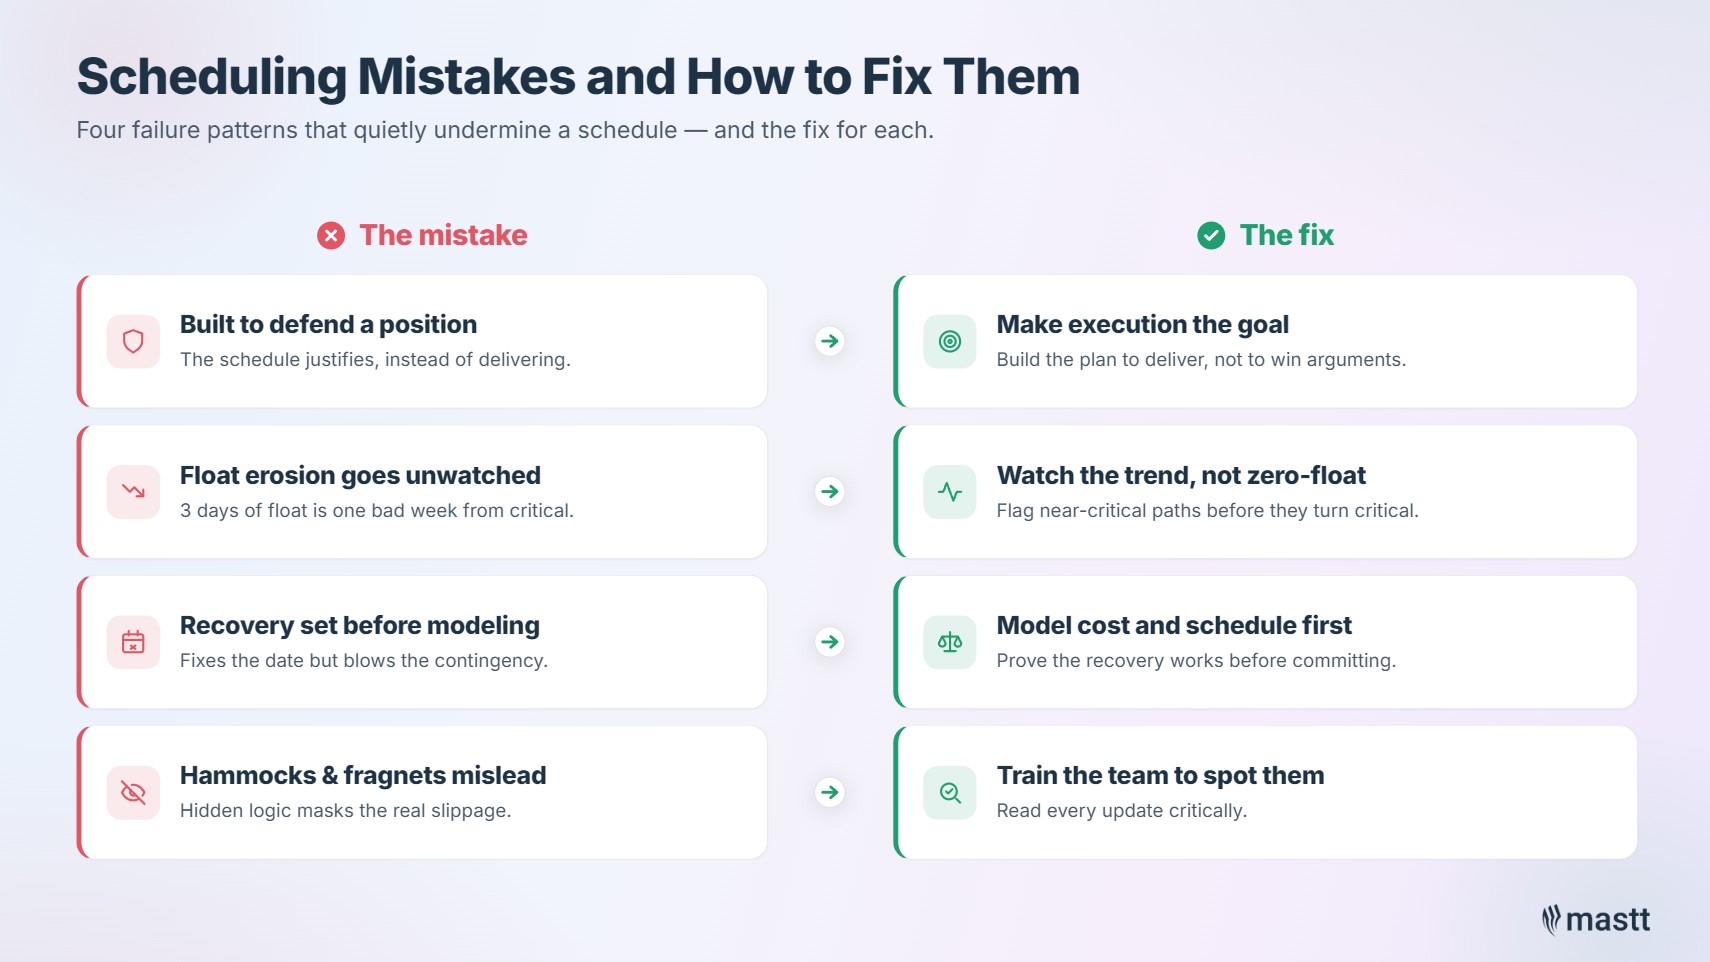
Four failure patterns to spot and fix:
Each one is visible in a weekly review. Spot the pattern by Wednesday afternoon and the team can usually fix it by the next review.
The points below are the ones owners and project managers act on first when they revisit their scheduling approach. They change how the schedule behaves, not just how it looks.
A useful construction schedule does one thing: it tells the project team what to do next and shows where the work is at risk. The methods are well established and the components are stable. The biggest gains today come from tightening the loop between schedule and field, running risk continuously, and putting both sides on one platform.
Start with the next update cycle. If the conversation in that meeting is about reconciling percent complete, the schedule is reporting. If it is about what the field is doing this week and what is trending toward critical, the schedule is steering.
For deeper detail on connected topics in the cluster:
Written by
Jackson Row is the Growth & North American Market Lead at Mastt. With a background in risk modeling, cost forecasting, and integrated project delivery, he helps capital project owners work smarter and faster. Jackson’s work supports better tools, better data, and better outcomes across the construction industry.

Contributions from
Tim Mather is a former CTO and COO of PMA Technologies, where he spent 23 years developing construction scheduling and risk analysis software. He co-developed NetPoint® and NetRisk™ and co-authored "Core Traits of a Reliable Schedule." At Mastt, he writes on construction scheduling, project controls, and AI in construction.

Cut the stress of showing up unprepared
Start for FreeTrusted by the bold, the brave, and the brilliant to deliver the future


.avif)